










String Metaverse Limited H1 PAT rises 92.3% as margins expand
Key highlights
- String Metaverse Ltd. reported H1 FY27 revenue from operations of Rs 802.66 crore, up 86.1% year on year.
- String Metaverse Ltd.'s H1 FY27 EBITDA rose 91.3% to Rs 91.18 crore.
- String Metaverse Ltd.'s H1 FY27 consolidated PAT rose 92.3% to Rs 76.79 crore.
- String Metaverse Ltd. reported Q2 FY27 PAT of Rs 39.86 crore, up 84.2% year on year.
powered by IRIS
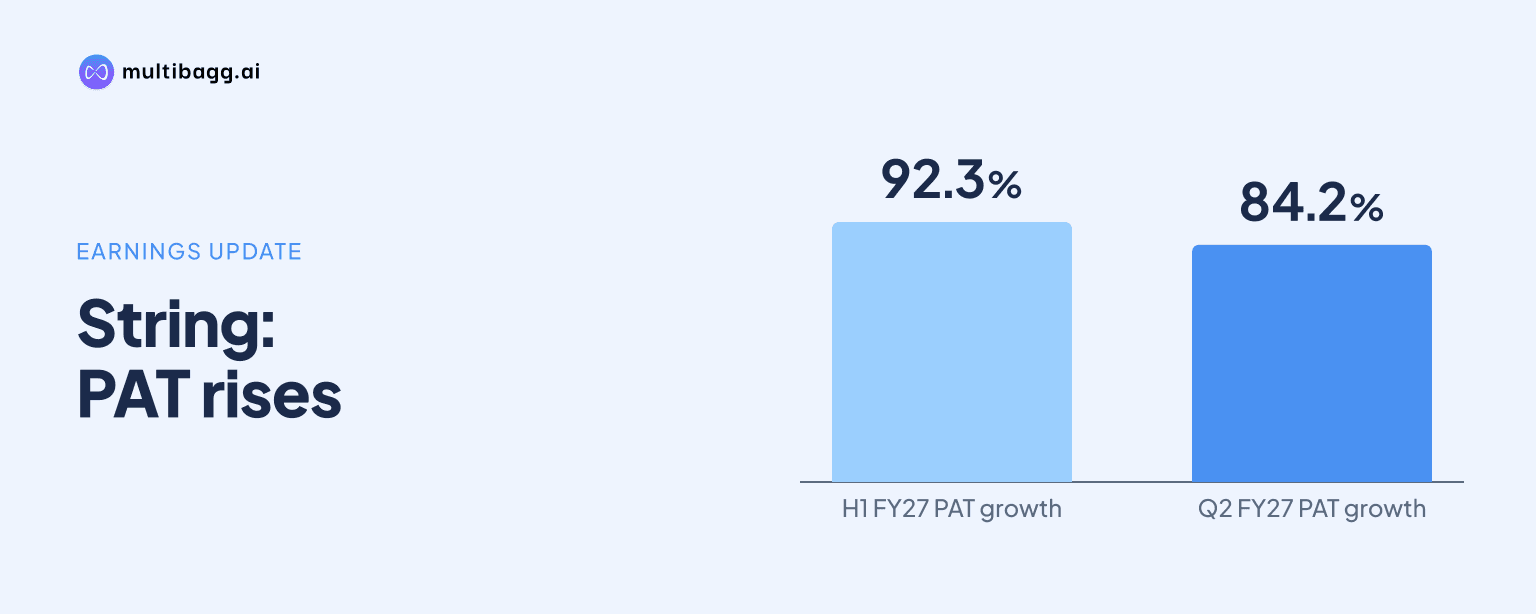
String Metaverse Limited reported H1 FY27 revenue from operations of Rs 802.66 crore, up 86.1% year on year, while consolidated profit after tax rose 92.3% to Rs 76.79 crore. Earnings before interest, tax, depreciation and amortisation increased 91.3% to Rs 91.18 crore, outpacing sales growth and lifting calculated margins from H1 FY26.
Know String Metaverse inside out
Results, valuation, peers and who's buying, in one view.
How fast did String Metaverse Ltd. grow in H1 FY27?
String Metaverse Ltd. increased revenue from operations by Rs 371.30 crore in H1 FY27, reaching Rs 802.66 crore from Rs 431.36 crore in H1 FY26. The presentation reports 86.1% year-on-year growth, meaning first-half revenue was nearly 1.9 times the corresponding prior-year period.
String Metaverse Ltd.'s operating profit, described in the presentation as EBITDA or profit before depreciation, interest and tax, rose by Rs 43.52 crore to Rs 91.18 crore. That 91.3% increase exceeded the 86.1% increase in revenue from operations, providing the basis for the calculated operating-margin improvement.
String Metaverse Ltd. also reported faster growth below the operating-profit line. Profit before tax increased from Rs 40.16 crore in H1 FY26 to Rs 76.93 crore in H1 FY27, while consolidated profit after tax, or PAT, rose from Rs 39.93 crore to Rs 76.79 crore. PAT added Rs 36.86 crore year on year and grew at a higher rate than revenue.
Did String Metaverse Ltd.'s H1 FY27 margins improve?
String Metaverse Ltd.'s calculated EBITDA margin rose to 11.36% in H1 FY27 from about 11.05% in H1 FY26, based on EBITDA of Rs 91.18 crore and revenue from operations of Rs 802.66 crore. The change follows EBITDA growth of 91.3%, compared with revenue growth of 86.1%.
String Metaverse Ltd.'s calculated PAT margin rose to about 9.57% from about 9.26% a year earlier. This compares consolidated PAT of Rs 76.79 crore with H1 FY27 revenue from operations of Rs 802.66 crore, and PAT of Rs 39.93 crore with H1 FY26 revenue of Rs 431.36 crore.
String Metaverse Ltd. separately identifies an H1 FY27 EBITDA margin of 11.36% on its Rule of 40 slide. That slide combines a cited 75.93% revenue-growth figure with the 11.36% EBITDA margin to produce an 87.29% Rule of 40 result, against the presentation's stated 40% baseline; the H1 summary reports revenue growth of 86.1%.
What did String Metaverse Ltd. report for Q2 FY27?
String Metaverse Ltd. reported Q2 FY27 revenue from operations of Rs 410.26 crore, up 76.5% year on year and 4.5% quarter on quarter. EBITDA was Rs 47.32 crore, up 83.2% year on year, while the stated EBITDA margin was 11.5%, compared with 11.1% in Q2 FY26.
String Metaverse Ltd.'s consolidated profit before tax was Rs 40.03 crore in Q2 FY27, up 83.8% year on year and 8.5% quarter on quarter. Consolidated PAT was Rs 39.86 crore, an 84.2% year-on-year increase and an 8.0% sequential increase, exceeding the reported quarterly revenue-growth rate on both comparisons.
String Metaverse Ltd.'s quarterly revenue chart uses total income rather than revenue from operations and gives Q2 FY27 total income of Rs 410.41 crore. The Q2 summary gives Rs 410.26 crore for revenue from operations, while the chart is explicitly labelled as a total-income series consistent with the Q1 FY27 presentation.
Got a follow-up? Ask IRIS
How has String Metaverse Ltd.'s quarterly performance changed?
String Metaverse Ltd.'s total income increased from Rs 199.07 crore in Q1 FY26 to Rs 410.41 crore in Q2 FY27, which the presentation describes as 2.1 times growth over six quarters. During FY27, total income moved from Rs 392.42 crore in Q1 to Rs 410.41 crore in Q2, an increase of Rs 17.99 crore.
String Metaverse Ltd. reported total income of Rs 233.27 crore in Q2 FY26, Rs 278.79 crore in Q3 FY26 and Rs 365.42 crore in Q4 FY26. Quarterly total income rose in each of the six displayed quarters, although the Q2 FY27 increase was smaller than the Rs 86.63 crore rise from Q3 FY26 to Q4 FY26.
String Metaverse Ltd.'s net profit followed the same direction, increasing from Rs 18.30 crore in Q1 FY26 to Rs 39.86 crore in Q2 FY27. The presentation calls this 2.2 times growth over six quarters; net profit was Rs 36.92 crore in Q1 FY27, making the Q2 increase Rs 2.94 crore.
How close is String Metaverse Ltd. to its FY26 profit level?
String Metaverse Ltd.'s H1 FY27 PAT of Rs 76.79 crore was 75% of its full-year FY26 PAT of Rs 102.53 crore, according to the presentation. The difference between the H1 FY27 amount and FY26's full-year PAT was Rs 25.74 crore, with half the financial year still remaining.
String Metaverse Ltd. presents this as a comparison with the prior financial year rather than as a FY27 forecast. The supplied presentation does not disclose a full-year FY27 revenue, EBITDA or PAT target, so the reported H1 figures establish a first-half result but not management guidance for the second half.
Conclusion
String Metaverse Ltd. reported H1 FY27 profit growth ahead of revenue growth: revenue from operations increased 86.1% to Rs 802.66 crore, EBITDA increased 91.3% to Rs 91.18 crore and PAT increased 92.3% to Rs 76.79 crore. Those relative growth rates resulted in calculated EBITDA and PAT margin increases from H1 FY26, while Q2 maintained year-on-year growth in revenue and profit.
The next result period to watch is the second half of FY27, when String Metaverse Ltd. will report whether H1 PAT of Rs 76.79 crore rises above FY26 full-year PAT of Rs 102.53 crore. Readers should also track the distinction between revenue from operations and total income, reported for Q2 FY27 at Rs 410.26 crore and Rs 410.41 crore, respectively.