










TNPL operating cash flow rises sixfold to Rs 307.35 crore
Key highlights
- TNPL's net operating cash flow was Rs 307.35 crore in the half year ended 30 September 2026, versus Rs 50.89 crore a year earlier.
- Inventories increased by Rs 110.82 crore in the half year and closed at Rs 1,083.15 crore on 30 September 2026.
- TNPL spent Rs 213.83 crore on fixed assets, capital work-in-progress and capital advances in the half year.
- Current borrowings rose to Rs 825.42 crore at 30 September 2026 from Rs 751.17 crore at 31 March 2026.
powered by IRIS
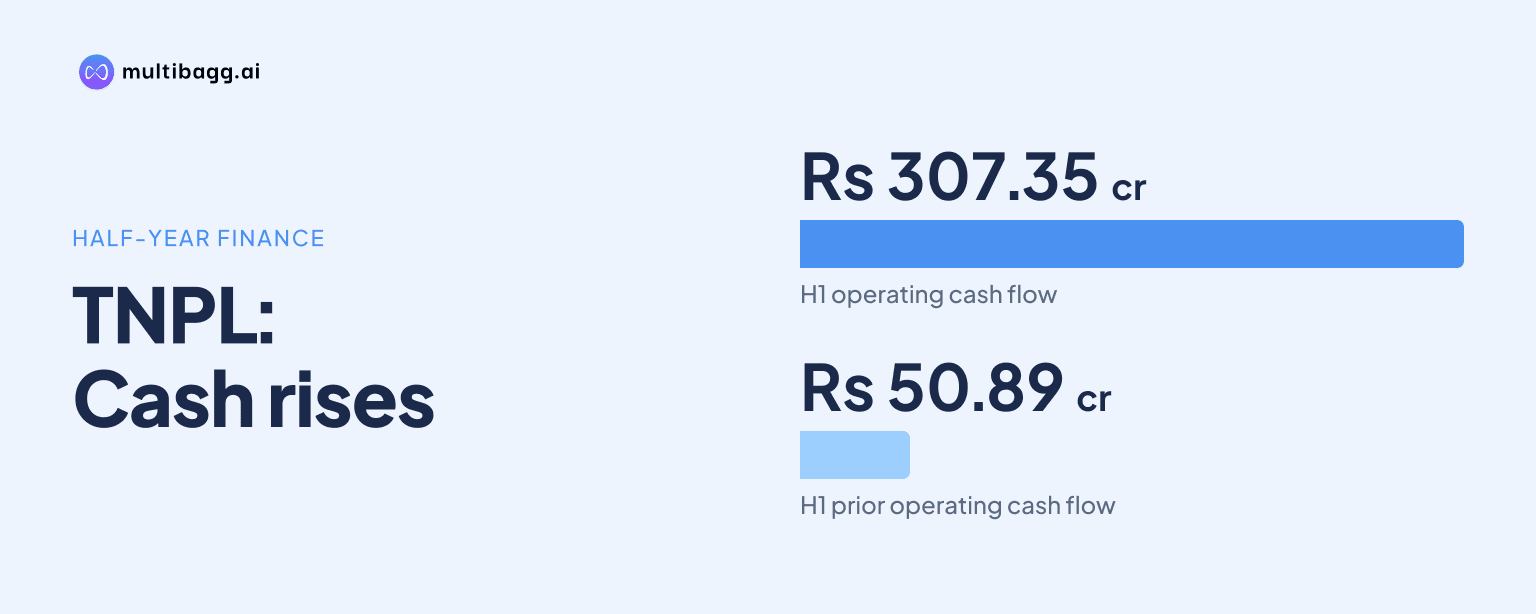
Tamil Nadu Newsprint and Papers Limited (TNPL) generated net operating cash flow of Rs 307.35 crore in the half year ended 30 September 2026, compared with Rs 50.89 crore a year earlier, as working-capital movements improved despite a Rs 110.82 crore inventory increase. Capital additions absorbed Rs 213.83 crore and net cash and cash equivalents ended at negative Rs 21.11 crore.
Know Tamil Nadu Newsprint & Papers inside out
Results, valuation, peers and who's buying, in one view.
Why did TNPL's operating cash flow increase in the half year?
TNPL's net cash from operating activities increased to Rs 307.35 crore in the half year ended 30 September 2026 from Rs 50.89 crore in the corresponding half year of 2025. Cash from operations before income tax was Rs 316.90 crore, reversing an outflow of Rs 68.86 crore in the earlier period, while profit before tax rose to Rs 14.15 crore from Rs 1.11 crore.
The cash-flow improvement was mainly linked to working-capital movements rather than a large change in pre-working-capital operating profit. Operating profit before working-capital changes was Rs 259.92 crore, compared with Rs 248.35 crore a year earlier. Depreciation and amortisation were broadly unchanged at Rs 156.66 crore against Rs 155.75 crore, while finance cost in the reconciliation declined to Rs 88.37 crore from Rs 98.42 crore.
Trade receivables released Rs 18.81 crore of cash in the 2026 half year, compared with consuming Rs 155.28 crore in the prior-year period. Trade payables provided Rs 71.24 crore, whereas they reduced cash by Rs 28.42 crore a year earlier. Other current assets provided Rs 6.07 crore, compared with a Rs 98.77 crore cash use in the earlier half year.
Inventory was the principal operating-cash offset. The cash-flow statement records a Rs 110.82 crore inventory increase in the half year to September 2026, larger than the Rs 31.82 crore increase a year earlier. Closing inventories were Rs 1,083.15 crore at 30 September 2026, up from Rs 972.35 crore at 31 March 2026.
How much did TNPL spend on capital assets?
TNPL used Rs 213.71 crore in net investing activities in the half year ended 30 September 2026, compared with Rs 105.30 crore in the corresponding prior-year half. Additions to fixed assets, capital work-in-progress and capital advances were Rs 213.83 crore, against Rs 112.93 crore a year earlier. Interest income of Rs 7 lakh and rental income of Rs 5 lakh partly offset the investment outflow.
Capital work-in-progress increased to Rs 602.24 crore at 30 September 2026 from Rs 473.39 crore at 31 March 2026. Property, plant and equipment declined to Rs 3,750.75 crore from Rs 3,865.36 crore over the same six months, alongside the Rs 156.66 crore depreciation and amortisation charge reported for the half year.
Total non-current assets rose to Rs 4,427.08 crore from Rs 4,414.97 crore. Biological assets increased to Rs 8 crore from Rs 7.24 crore, investments rose to Rs 1.17 crore from Rs 88 lakh, and other non-current assets reached Rs 29.59 crore from Rs 27.16 crore. These balance-sheet movements occurred alongside the higher capital-addition outflow.
Got a follow-up? Ask IRIS
How did TNPL's operations compare with the prior half year?
TNPL reported revenue from operations of Rs 2,350.16 crore for the half year ended 30 September 2026, up from Rs 2,252.25 crore in the corresponding period of 2025. Total income rose to Rs 2,376.89 crore from Rs 2,282.94 crore, while profit after tax increased to Rs 10.19 crore from Rs 69 lakh.
Paper and paper board segment revenue was Rs 2,340.62 crore, compared with Rs 2,239.77 crore a year earlier. Energy segment revenue increased to Rs 350.54 crore from Rs 290.47 crore, before elimination of inter-segment revenue of Rs 341 crore. Segment profit before tax and interest was Rs 106.03 crore for paper and paper board and Rs 2.71 crore for energy.
Expenses also increased during the period. Power, fuel and water charges rose to Rs 526.49 crore from Rs 410.09 crore, while employee benefit expense increased to Rs 255.77 crore from Rs 237.12 crore. Cost of materials consumed was Rs 1,109.20 crore, slightly below Rs 1,113.38 crore a year earlier.
What changed in TNPL's borrowings and liquidity position?
TNPL's reported borrowings increased to Rs 1,613.80 crore at 30 September 2026 from Rs 1,598.83 crore at 31 March 2026. Non-current borrowings fell to Rs 788.38 crore from Rs 847.66 crore, but current borrowings increased to Rs 825.42 crore from Rs 751.17 crore.
Financing activities used Rs 122.93 crore of cash in the half year, compared with an inflow of Rs 191.48 crore in the corresponding 2025 period. TNPL received Rs 103.52 crore from borrowings and repaid Rs 132.56 crore, while short-term borrowings increased by Rs 24.98 crore. Interest paid was Rs 89.05 crore and dividends paid were Rs 27.68 crore.
Net cash and cash equivalents were negative Rs 21.11 crore at 30 September 2026, compared with negative Rs 4.33 crore a year earlier and positive Rs 8.18 crore at 31 March 2026. The period-end position comprised Rs 3.32 crore of cash and cash equivalents and Rs 24.43 crore of bank overdrafts classified as cash credit. Total cash and cash equivalents declined by Rs 29.29 crore during the half year.
How did TNPL's balance sheet change by September 2026?
TNPL's total assets increased to Rs 6,307.06 crore at 30 September 2026 from Rs 6,210.11 crore at 31 March 2026. Current assets rose to Rs 1,879.98 crore from Rs 1,795.14 crore, led by the Rs 110.80 crore rise in inventories, while trade receivables fell to Rs 594.62 crore from Rs 613.38 crore.
Total current liabilities increased to Rs 2,777.47 crore from Rs 2,604.98 crore. Trade payables to creditors other than micro and small enterprises rose to Rs 1,556.78 crore from Rs 1,480.34 crore, and other current liabilities increased to Rs 136.86 crore from Rs 110.93 crore. Total equity declined to Rs 2,295.32 crore from Rs 2,315.98 crore, with other equity at Rs 2,225.94 crore.
Conclusion
TNPL's half-year statements show a substantial improvement in operating cash generation, with net operating cash flow rising to Rs 307.35 crore from Rs 50.89 crore. Cash released from receivables and other current assets, plus higher trade payables, outweighed the Rs 110.82 crore inventory build and supported cash generation despite profit before tax of Rs 14.15 crore.
The next reported results will show whether inventories, which stood at Rs 1,083.15 crore at 30 September 2026, are reduced or rise further, and whether capital work-in-progress continues above Rs 602.24 crore. TNPL's cash position will also depend on the balance between capital additions, current borrowings of Rs 825.42 crore and the Rs 24.43 crore cash-credit overdraft at period end.