










Intelligent Supply Chain Infrastructure Trust coverage at 0.54x
Key highlights
- Debt-service coverage was 0.54 times for the quarter ended September 30, 2026, versus 0.24 times a year earlier.
- Net borrowings ratio declined to 0.40 at September 30, 2026 from 0.44 a year earlier.
- Consolidated net borrowings fell to Rs 2,141.31 crore from Rs 2,435.59 crore year on year.
- Deferred payments, identified as lease liabilities, fell to Rs 19.87 crore from Rs 313.90 crore year on year.
powered by IRIS
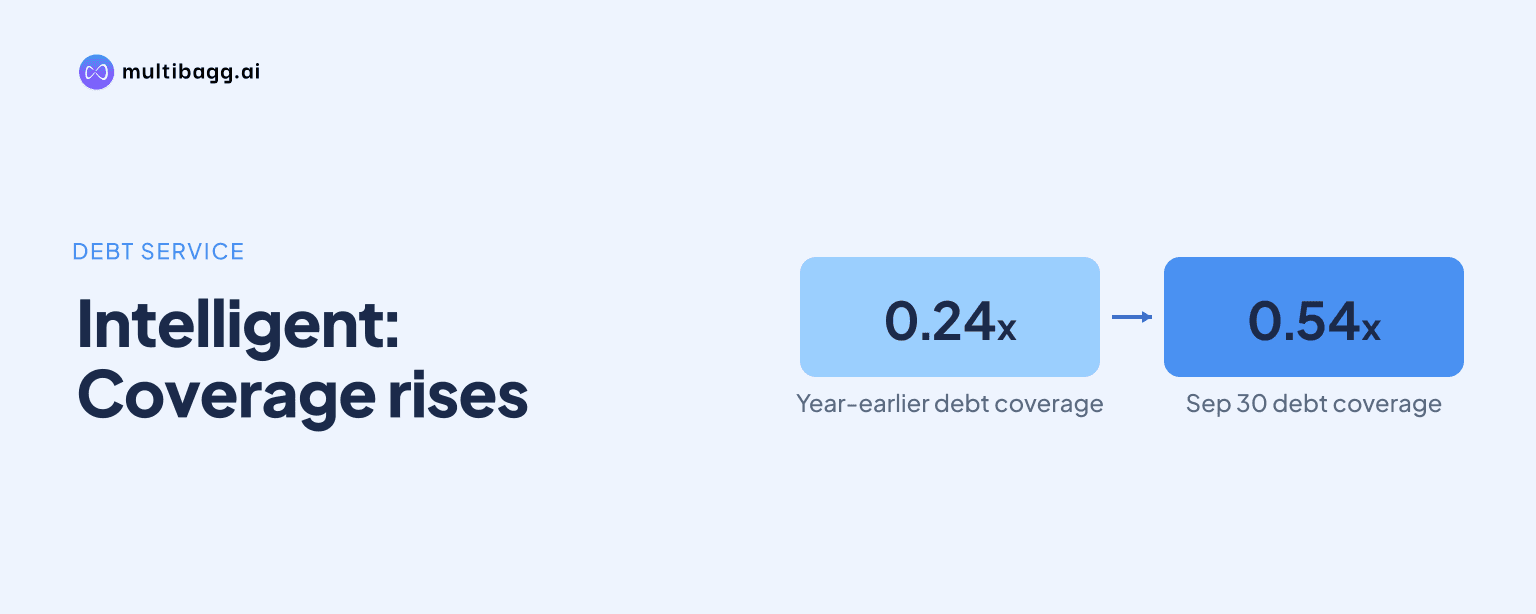
Intelligent Supply Chain Infrastructure Trust reported debt-service coverage of 0.54 times for the quarter ended September 30, 2026, below one, while its consolidated net borrowings ratio fell to 0.40 from 0.44 a year earlier. The Trust recorded net borrowings of Rs 2,141.31 crore against InvIT asset value of Rs 5,291.08 crore.
Know Intelligent Supply Chain Infrastructure Trust inside out
Results, valuation, peers and who's buying, in one view.
Why was the Trust's debt-service coverage below one?
The Trust's debt-service coverage ratio was 0.54 times in the quarter ended September 30, 2026, compared with 0.46 times in the June 2026 quarter and 0.24 times in the September 2025 quarter. The disclosed ratio improved from both comparison periods but remained below 1 time.
The Trust defines debt-service coverage as earnings before interest, tax and exceptional items divided by interest expense plus principal repayments made during the period for lease liabilities and long-term loans. Its 0.49-times ratio for the half year ended September 30, 2026 was above 0.12 times in the prior-year half, while the ratio for the year ended March 31, 2026 was 0.30 times.
The Trust's interest-service coverage was 0.96 times in the September 2026 quarter, versus 1.04 times in June 2026 and 0.48 times a year earlier. This ratio uses earnings before interest, tax and exceptional items divided only by interest expense, unlike debt-service coverage, which also includes specified principal repayments.
How did the Trust's net borrowings ratio change?
The Trust's consolidated net borrowings ratio declined to 0.40 at September 30, 2026 from 0.43 at March 31, 2026 and 0.44 at September 30, 2025. The ratio is calculated as aggregate borrowings and deferred payments, net of cash and cash equivalents, divided by the value of InvIT assets.
Consolidated net borrowings were Rs 2,141.31 crore at September 30, 2026, down from Rs 2,276.71 crore at March 31, 2026 and Rs 2,435.59 crore a year earlier. Consolidated borrowings stayed at Rs 2,122 crore across all three reported dates, while deferred payments, described as lease liabilities, fell to Rs 19.87 crore from Rs 313.90 crore a year earlier.
The Trust's InvIT asset value was Rs 5,291.08 crore at September 30, 2026, compared with Rs 5,534.11 crore a year earlier. The disclosure states that this value uses the enterprise value of the special purpose vehicle, or SPV, based on the March 31, 2026 valuation report, with adjustments for leased assets, SPV liquid mutual fund investments, other assets and Trust current liabilities.
Got a follow-up? Ask IRIS
What happened to the Trust's other debt and balance-sheet ratios?
The Trust reported a debt-equity ratio of 1.14 times for the September 2026 quarter, up from 1.09 times in June 2026 and 0.97 times in September 2025. Total debt to total assets was 0.52 times, compared with 0.51 times in the prior quarter and 0.45 times a year earlier.
The Trust's asset coverage ratio declined to 1.88 times in September 2026 from 2.02 times in June 2026 and 2.04 times in September 2025. Net worth, described as unitholders' funds, was Rs 1,856.63 crore, down from Rs 1,944.26 crore in June 2026 and Rs 2,189.69 crore a year earlier.
The reported current ratio was 2.49 times for the September 2026 quarter, versus 3.57 times in June 2026, 0.86 times in September 2025 and 1.28 times for the year ended March 31, 2026. The Trust's formula table defines the current ratio using current assets and current liabilities.
How did the Trust's earnings and distributions change?
The Trust reported an earnings before interest, tax, depreciation and amortisation, or EBITDA, margin of 52% in the September 2026 quarter, down from 63% in June 2026 and 54% in September 2025. Its half-year EBITDA margin was 58%, compared with 48% in the corresponding prior-year period.
The Trust recorded a loss after tax of Rs 2.42 crore in the September 2026 quarter, compared with profit after tax of Rs 2.49 crore in June 2026 and a loss of Rs 39.32 crore a year earlier. Net profit margin was negative 0.70%, against positive 0.72% in June 2026 and negative 11.41% in September 2025.
The Trust reported profit after tax of Rs 0.07 crore for the half year ended September 30, 2026, compared with a Rs 117.75 crore loss in the prior-year half. Distribution per unit was Rs 2.80 in the September quarter, above Rs 2.75 in June 2026 and Rs 2.78 a year earlier; the half-year distribution was unchanged year on year at Rs 5.55.
Conclusion
The Trust's ratio disclosures show that net borrowings fell faster than the stated value of InvIT assets over the year to September 30, 2026, reducing the net borrowings ratio to 0.40. However, the 0.54-times debt-service coverage ratio remained below one despite improving from 0.24 times in the comparable 2025 quarter.
The next results will show whether debt-service coverage moves above the September-quarter 0.54-times level and whether deferred payments continue to decline from Rs 19.87 crore. Borrowings remained Rs 2,122 crore at September 2025, March 2026 and September 2026, making changes in lease liabilities, cash and asset value relevant to the reported net borrowings ratio.