










Turtlemint active partners grew at 51% CAGR through fiscal 2026
Key highlights
- Turtlemint’s quarterly average active transacting digital partners rose from 7,046 in FY20 to 83,657 in FY26, a reported 51% CAGR.
- Turtlemint’s FY20 digital partner cohort reached 3.8 times its initial average earnings by FY26.
- Turtlemint reported FY26 platform premium of Rs 3,868 crore and revenue from operations of Rs 1,098 crore.
- Turtlemint had 659,073 verified digital partners and 46 integrated insurers as of March 31, 2026.
powered by IRIS
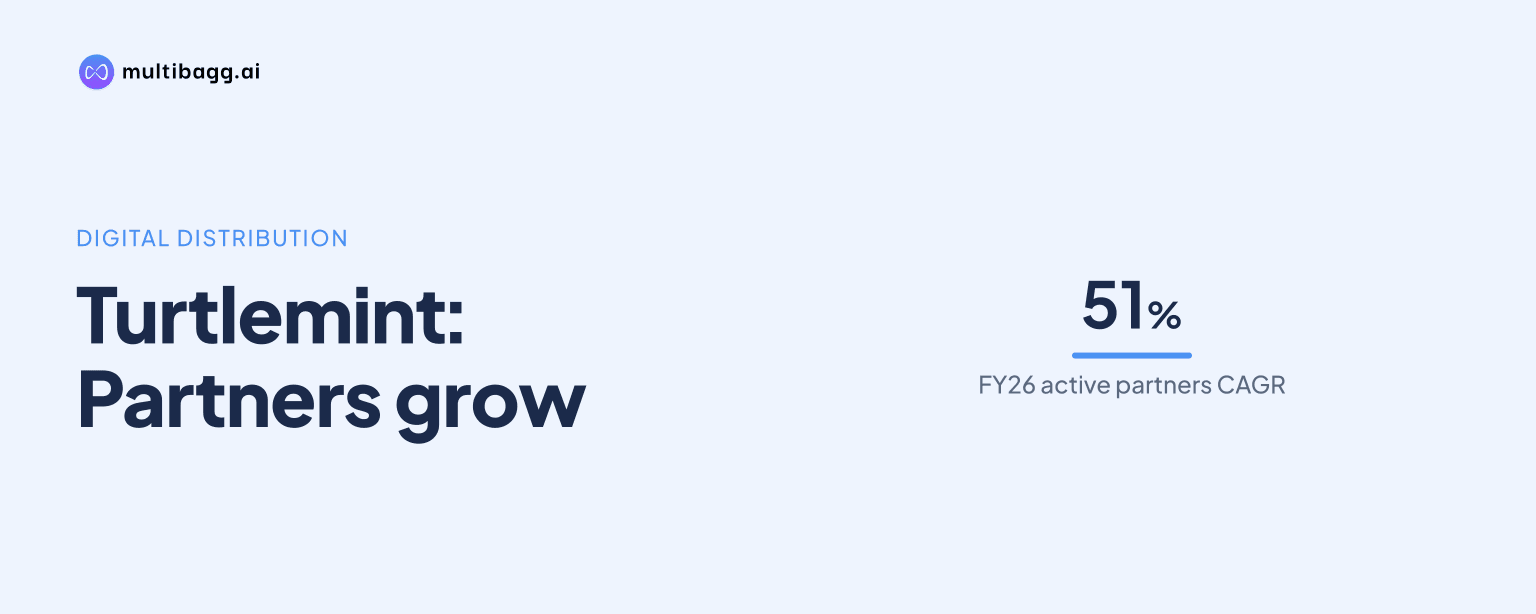
Turtlemint Fintech Solution Ltd increased quarterly average active transacting digital partners at a reported 51% compound annual growth rate from 7,046 in FY20 to 83,657 in FY26, while its FY20 partner cohort reached 3.8 times its initial average earnings by FY26. The figures link network expansion with higher average payouts among older partner cohorts.
Know Turtlemint Fintech Solutions inside out
Results, valuation, peers and who's buying, in one view.
How fast did Turtlemint’s active partner network grow?
Turtlemint’s quarterly average active transacting digital partner base rose from 7,046 in FY20 to 83,657 in FY26, a reported 51% compound annual growth rate. This measure refers to digital partners actively transacting during the relevant quarters, rather than the full verified partner population.
The active base increased in every financial year in the series, although the number of additions changed. It rose from 14,188 in FY21 to 24,485 in FY22 and 38,702 in FY23, before reaching 49,668 in FY24, 63,048 in FY25 and 83,657 in FY26. The FY26 result was 20,609 higher than the FY25 quarterly average.
The verified digital partner base expanded at a lower reported 33% compound annual growth rate, from 119,643 in FY20 to 659,073 in FY26. The FY26 active quarterly average of 83,657 is therefore distinct from the March 31, 2026 verified base. Turtlemint separately reported 94,800 three-month active partners in Q4 FY26, a quarter-end activity measure.
What do Turtlemint’s partner cohorts show about earnings?
Turtlemint’s cohort data show that average payouts generally increased as digital partner cohorts matured, led by the FY20 cohort at 3.8 times its FY20 average earnings in FY26. Turtlemint defines average earnings as total payouts received by a cohort in a year divided by the number of partners in that cohort that received a payout that year.
Other cohorts also ended FY26 above their entry-year baseline of 1.0 times. The FY21 cohort reached 3.4 times its initial average earnings, the FY22 cohort reached 3.2 times, the FY24 cohort reached 3.1 times and the FY25 cohort reached 2.1 times. These are comparisons within each cohort and do not measure payouts across all 659,073 verified partners.
The progression was not uniform in each year. The FY20 cohort was at 2.4 times its FY20 level in FY22 and FY23, slipped to 2.3 times in FY24, then rose to 2.8 times in FY25 and 3.8 times in FY26. The FY21 cohort similarly moved from 2.7 times in FY23 to 2.3 times in FY24 before reaching 3.4 times in FY26. Turtlemint attributes productivity and distribution-network scale to its platform, payout structures and training resources.
Got a follow-up? Ask IRIS
How did Turtlemint’s network expansion translate into premium and revenue?
Turtlemint reported platform premium of Rs 3,868 crore in FY26, up from Rs 699 crore in FY20, representing a reported 33% compound annual growth rate. Revenue from operations increased faster over the same period, at a reported 37% compound annual growth rate, from Rs 163 crore to Rs 1,098 crore.
Both measures grew more slowly in FY24 before accelerating in FY25 and FY26. Platform premium increased by Rs 58 crore from Rs 2,215 crore in FY23 to Rs 2,273 crore in FY24, followed by increases of Rs 673 crore in FY25 and Rs 922 crore in FY26. Revenue from operations rose by Rs 26 crore in FY24, Rs 136 crore in FY25 and Rs 398 crore in FY26.
Turtlemint’s FY26 distribution footprint was weighted towards B30+ geographies, which generated 75.36% of platform premium. As of March 31, 2026, the company reported coverage across 19,186 pin codes and 83 physical branches, with 46 insurers integrated on its platform. Its top 100 partners accounted for 4.62% of business.
What supports Turtlemint’s partner-distribution model?
Turtlemint identifies technology, training and partner-management systems as the operating mechanisms supporting its distribution network. The turtlemint PRO application supports onboarding, know-your-customer processes and insurance transactions, while turtlemint ACADEMY provides certification and upskilling for digital partners.
Its ninja customer relationship management platform tracks partner business, quotes and renewals in real time. On the insurer and enterprise side, INSURANCE HUB provides product integrations and turtlefin is a white-labelled insurance distribution platform. These products serve a network that had issued 2.95 crore policies and recorded more than 4.98 million turtlemint PRO app downloads by March 31, 2026.
The historical series has a reporting-basis qualification. Turtlemint acquired Turtlemint Insurance Broking Services Private Limited, described as a material subsidiary, effective May 8, 2024. Operational and financial figures from FY20 through FY25 are pro forma information compiled voluntarily by management, while FY26 figures are consolidated; the presentation says the data were certified by independent chartered accountants.
Conclusion
Turtlemint’s data show that distribution growth combined a larger active partner base with generally higher average payouts for established cohorts. Quarterly average active transacting partners reached 83,657 in FY26, while platform premium and revenue from operations reached Rs 3,868 crore and Rs 1,098 crore, respectively. The cohort trend includes interim declines for some groups, rather than uninterrupted annual payout growth.
The presentation provides no forward target for partner growth or earnings. The next disclosed comparison is H1 FY27, when active transacting partners averaged 93,580 against 76,249 in H1 FY26, platform premium was Rs 2,419 crore against Rs 1,590 crore, and revenue was Rs 637 crore against Rs 463 crore. Comparisons with FY20 through FY25 should continue to account for their pro forma basis.