










Turtlemint cuts H1 adjusted EBITDA loss to Rs 48 crore
Key highlights
- Turtlemint's H1 FY27 adjusted EBITDA loss narrowed to Rs 48 crore from Rs 77 crore in H1 FY26.
- Renewal revenue increased 52% to Rs 136 crore in H1 FY27 from Rs 89 crore a year earlier.
- Corporate overheads rose 3% to Rs 132 crore while revenue from operations increased 38% to Rs 637 crore.
- Quarterly average active transacting digital partners rose to 93,580 in H1 FY27 from 76,249 in H1 FY26.
powered by IRIS
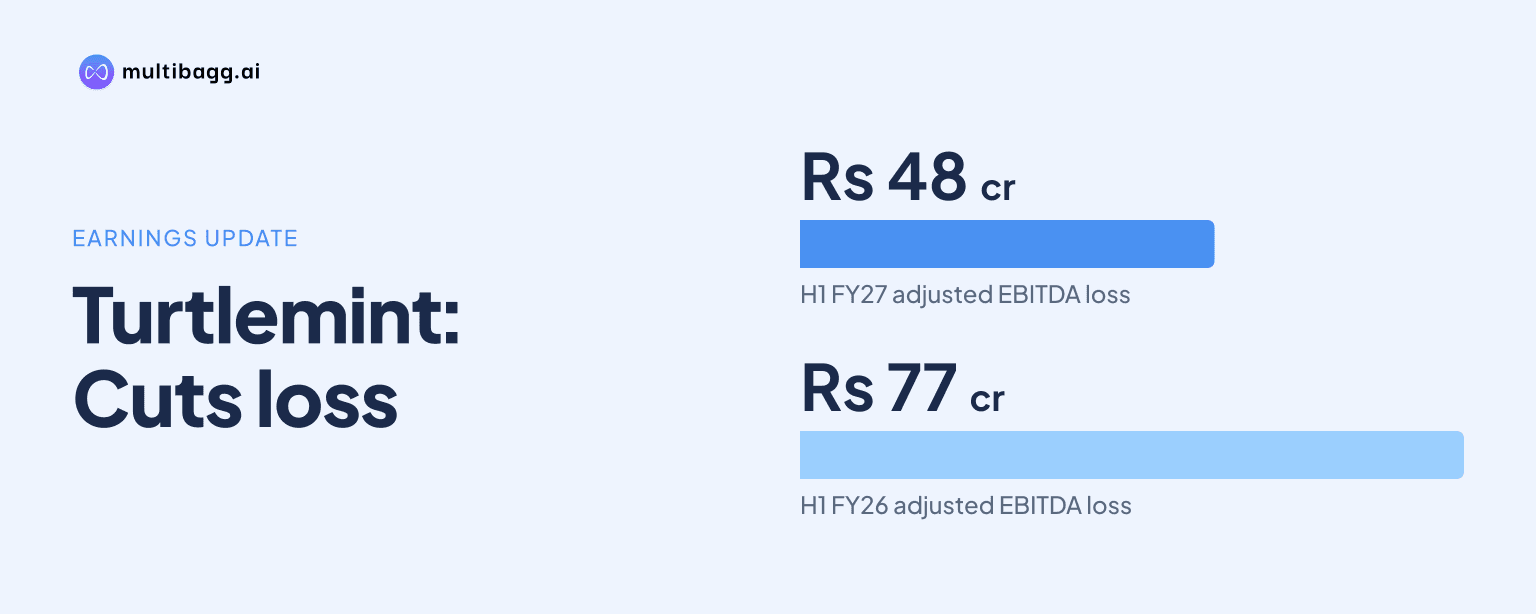
Turtlemint Fintech Solution Ltd cut its adjusted EBITDA loss to Rs 48 crore in H1 FY27 from Rs 77 crore a year earlier, as renewal revenue rose 52% to Rs 136 crore and revenue from operations grew 38% to Rs 637 crore.
Know Turtlemint Fintech Solutions inside out
Results, valuation, peers and who's buying, in one view.
How did Turtlemint's H1 FY27 profitability change?
Turtlemint reduced its adjusted earnings before interest, tax, depreciation and amortisation (EBITDA) loss by Rs 29 crore in H1 FY27, while its adjusted EBITDA margin improved to negative 7% of revenue from negative 17% in H1 FY26. Revenue from operations increased by Rs 174 crore year on year, and service EBITDA rose by Rs 34 crore to Rs 85 crore.
The reported improvement did not result in positive adjusted EBITDA. Service EBITDA, which the presentation reports before corporate overheads, increased 66%, faster than the 38% rise in revenue, while corporate overheads increased 3%. The financial figures in the presentation are certified by independent chartered accountant S K Patodia & Associates LLP.
Why did renewal revenue and overheads affect margins?
Renewal revenue increased to Rs 136 crore in H1 FY27 from Rs 89 crore in H1 FY26, a rise of Rs 47 crore or 52%. The presentation identifies growth in the renewal book as support for service EBITDA margin expansion, while total revenue from operations increased 38% to Rs 637 crore.
Service EBITDA increased from Rs 51 crore to Rs 85 crore during the same half-year comparison. The presentation does not provide product-level commission, claims, or cost data, so it does not quantify the separate contribution of renewal revenue to service EBITDA or adjusted EBITDA.
Corporate overheads rose to Rs 132 crore from Rs 128 crore, but their share of revenue declined by seven percentage points to 21% from 28%. Turtlemint states that this lower overhead ratio led to an improvement in adjusted EBITDA margins, as revenue grew by Rs 174 crore while overheads increased by Rs 4 crore.
What does Q2 FY27 show about the H1 trend?
Turtlemint reported a Rs 21 crore adjusted EBITDA loss in Q2 FY27, compared with a Rs 35 crore loss in Q2 FY26. The adjusted EBITDA margin improved to negative 6% from negative 14%, while revenue from operations rose 35% to Rs 342 crore.
Service EBITDA in Q2 FY27 increased 47% to Rs 45 crore from Rs 30 crore, while corporate overheads were unchanged at Rs 66 crore. As a result, overheads fell to 19% of revenue from 26% in the prior-year quarter, extending the H1 pattern of revenue growth outpacing overhead growth.
Q2 FY27 renewal revenue was Rs 71 crore, up 41% year on year. That quarterly growth rate was below the 52% increase reported for H1 FY27, although both the Q2 and H1 disclosures show renewal revenue rising year on year.
Got a follow-up? Ask IRIS
What do Turtlemint's operating metrics show?
Turtlemint reported 728,138 digital partners in H1 FY27 and said it recruited more than 69,000 digital partners during the half year. Its quarterly average active transacting digital partners, defined in the presentation as partners issuing a policy, increased to 93,580 from 76,249 in H1 FY26.
Platform premium increased to Rs 2,419 crore in H1 FY27 from Rs 1,590 crore in H1 FY26, a 52% increase. Turtlemint also reported 3.4 million policies issued, 46 insurer partners, and 75.58% of platform premium distributed in B30+ markets, compared with 74.25% in H1 FY26.
The Q2 FY27 snapshot reported more than 93,000 quarterly active digital partners and 37,000 recruited digital partners. It also reported that more than 76% of premium came from B30+ markets, consistent with the detailed H1 table's 75.58% figure after rounding.
How did the reported loss and comparability change?
Turtlemint reported an EBITDA loss of Rs 48 crore in H1 FY27, compared with an Rs 82 crore EBITDA loss in H1 FY26. Loss before exceptional items and tax narrowed to Rs 61 crore from Rs 91 crore, while profit before tax was also a Rs 61 crore loss because no exceptional item was reported for H1 FY27.
The income statement reported a Rs 64 crore loss after tax for H1 FY27, compared with a Rs 125 crore loss in H1 FY26, which included a Rs 34 crore exceptional item. A separate slide shows an H1 FY26 loss after tax of Rs 92 crore and a negative 20% margin, with a note that the FY26 profit-after-tax figure excludes exceptional items; the supplied pages do not reconcile the Rs 92 crore and Rs 125 crore figures.
Historical comparison also has an acquisition qualification. Turtlemint says it acquired Turtlemint Insurance Broking Services Private Limited, described as a material subsidiary, effective May 8, 2024; management voluntarily compiled pro forma FY24 and FY25 information, while FY26, H1 FY26 and H1 FY27 figures are labelled consolidated.
Conclusion
Turtlemint's H1 FY27 results show a smaller reported operating loss as service EBITDA rose 66% to Rs 85 crore, renewal revenue grew 52% to Rs 136 crore, and corporate overheads rose 3% to Rs 132 crore. Revenue growth of 38% to Rs 637 crore reduced the adjusted EBITDA margin deficit by 10 percentage points and narrowed the income-statement loss after tax to Rs 64 crore.
The next disclosure should show whether renewal revenue continues to grow relative to total revenue and whether corporate overheads remain contained as revenue changes. Readers should also watch for a reconciliation of the Rs 92 crore and Rs 125 crore H1 FY26 loss-after-tax figures, as the presentation identifies exceptional-item treatment as the difference between the disclosures.