










V2 Retail Limited adds 106 stores as H1 sales density falls
Key highlights
- V2 Retail opened 106 stores and closed four in H1FY27, ending with 427 outlets.
- Monthly sales per square foot declined to Rs 785 in H1FY27 from Rs 948 in H1FY26.
- H1FY27 same-store sales growth was approximately negative 3.7%, while volume grew 43% year on year.
- H1FY27 revenue rose 42% to Rs 1,902.8 crore and EBITDA increased 50% to Rs 259.7 crore.
powered by IRIS
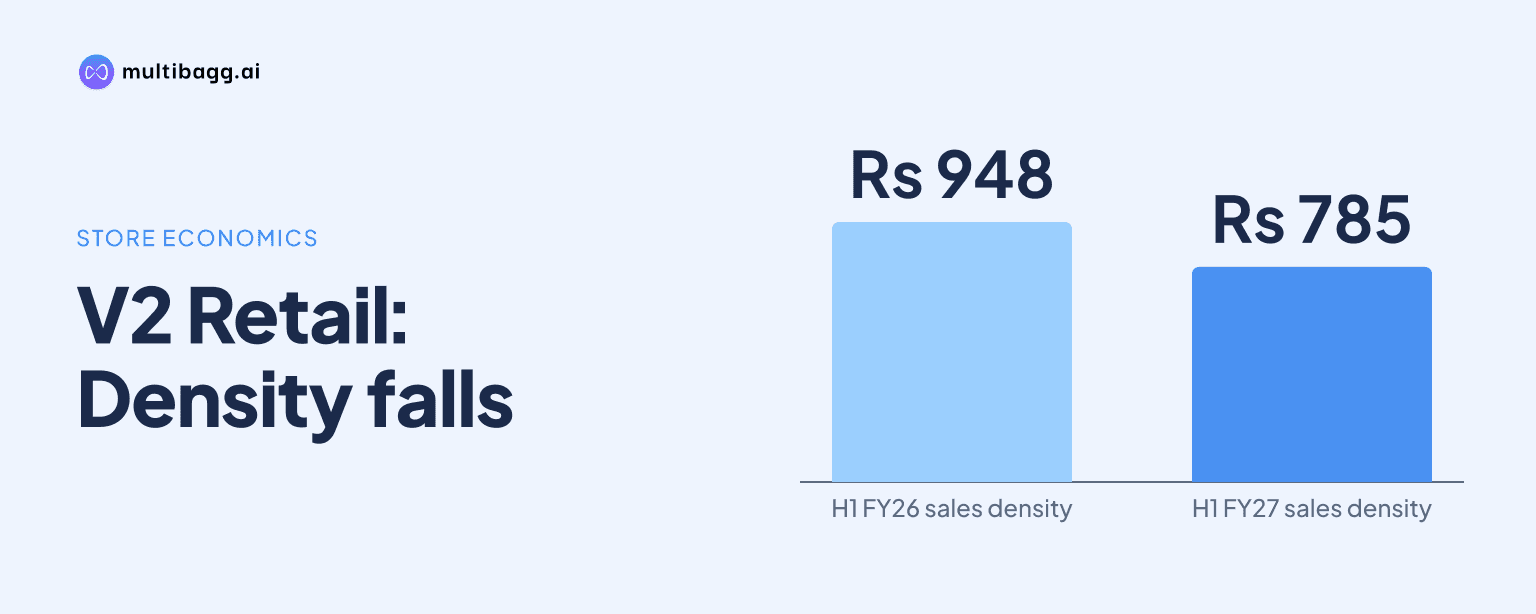
V2 Retail Limited opened 106 stores and closed four in H1FY27, ending 30 September 2026 with 427 outlets, while monthly sales per square foot fell to Rs 785 from Rs 948 in H1FY26. The company reported same-store sales growth of approximately negative 3.7%, despite 43% year-on-year volume growth during the half year.
Know V2 Retail inside out
Results, valuation, peers and who's buying, in one view.
How quickly did V2 Retail expand its store network?
V2 Retail expanded its network by 106 openings and four closures in H1FY27, reaching 427 stores and approximately 46.3 lakh square feet of retail area. In Q2FY27 alone, it opened 49 stores and closed three. The half-year figures therefore imply that the remaining openings and one closure occurred in Q1FY27, although the presentation does not provide separate Q1 store data.
V2 Retail had stores across 27 states and regions and more than 340 cities as of 30 September 2026. Uttar Pradesh was the largest market with 67 outlets, followed by Bihar with 61, Odisha with 35, Madhya Pradesh with 32 and West Bengal with 28. These five states represented 223 of the 427-store network, while Assam had 27 stores, Karnataka had 24 and Punjab had 22.
The footprint was spread across northern, eastern, western and southern markets, but the store count remained concentrated in several larger state markets. Uttar Pradesh and Bihar together accounted for 128 stores, or nearly 30% of the 427 outlets. Kerala, Meghalaya, Nagaland and Tripura each had one store, while Maharashtra had five and Telangana had three.
What happened to V2 Retail’s same-store sales and sales density?
V2 Retail reported same-store sales growth of approximately negative 3.7% in H1FY27, while monthly sales per square foot declined to Rs 785 from Rs 948 in H1FY26. Same-store sales track performance at comparable outlets, whereas sales per square foot measures revenue generated by retail area. The decline in both measures came as the company added 106 stores during the half year.
Q2FY27 showed a larger reported same-store sales decline of 14.9%, although V2 Retail reported normalised same-store sales growth of 0.5% for the quarter. Monthly sales per square foot in Q2FY27 was Rs 700, compared with Rs 938 in Q2FY26. Average bill value was Rs 891 against Rs 899 a year earlier, and average selling price was Rs 307 against Rs 315.
For H1FY27, average bill value increased to Rs 917 from Rs 900, while average selling price declined to Rs 307 from Rs 309. Full-price sales at maximum retail price, or MRP, accounted for 91% of sales, compared with 92% a year earlier. Men’s wear was the largest merchandise category at 41% of revenue mix, followed by ladies wear at 29%, kids wear at 22% and lifestyle at 8%.
Got a follow-up? Ask IRIS
How did V2 Retail’s H1FY27 financial results change?
V2 Retail reported consolidated revenue of Rs 1,902.8 crore in H1FY27, up 42% from Rs 1,340.9 crore in H1FY26, and earnings before interest, tax, depreciation and amortisation, or EBITDA, increased 50% to Rs 259.7 crore. The revenue increase was reported alongside 43% volume growth, 106 store openings and negative 3.7% same-store sales growth.
Gross profit margin rose to 29.8% in H1FY27 from 28.7% in H1FY26, while EBITDA margin increased to 13.6% from 12.9%. Profit after tax rose to Rs 60.1 crore from Rs 41.9 crore, with the margin increasing to 3.2% from 3.1%. These margin changes contrast with the fall in reported comparable-store sales and sales density.
Q2FY27 revenue was Rs 905.6 crore, compared with Rs 997.2 crore in Q1FY27. Quarterly profit after tax was Rs 18.2 crore in Q2FY27, versus Rs 41.9 crore in Q1FY27. On a year-on-year basis, Q2 revenue increased 28% from Rs 708.6 crore, while Q2 profit after tax increased 6% from Rs 17.2 crore.
What changed in V2 Retail’s working capital?
V2 Retail’s net working capital increased to 88 days of sales in H1FY27 from 45 days in H1FY26 and 81 days in FY26. Inventory increased to 146 days of sales from 124 days a year earlier, while creditors declined to 58 days from 80 days. The presentation also reports net working capital at 88 days for Q2FY27.
Inventory per square foot was Rs 3,125 in H1FY27, compared with Rs 2,885 in H1FY26. Store inventory increased to Rs 1,978 per square foot from Rs 1,855, and distribution-centre inventory increased to Rs 1,147 per square foot from Rs 1,030. Total inventory per square foot was below the Rs 3,226 reported for FY26, although inventory days were above the FY26 level of 136 days.
V2 Retail reported return on equity of 19.3% in H1FY27, down from 27.1% in H1FY26 and 26.0% in FY26. The presentation does not disclose a store-opening target, sales-density target or working-capital reduction plan. It does disclose the operating measures needed to compare future periods, including store count, sales per square foot, inventory days and creditor days.
Conclusion
V2 Retail’s H1FY27 performance combines rapid physical expansion with lower mature-store productivity. The 106 openings helped take the network to 427 stores and supported 42% revenue growth, but same-store sales declined approximately 3.7% and monthly sales per square foot fell by Rs 163 year on year. Gross profit, EBITDA and profit after tax increased, while working capital rose to 88 days of sales.
What to watch next is whether sales per square foot and comparable-store sales improve as the 46.3 lakh-square-foot network develops, and whether inventory and creditor movements change the 88-day net working-capital position. V2 Retail’s Q2FY27 normalised same-store sales growth of 0.5%, compared with the reported 14.9% decline, is another disclosed operating measure for comparison when the company reports subsequent periods.