










V2 Retail Q2 EBITDA rises 41% while PAT increases only 6%
Key highlights
- V2 reported Q2 FY27 revenue of Rs 905.6 crore, up 28% year on year.
- V2’s Q2 FY27 EBITDA increased 41% to Rs 120.3 crore, and its margin rose to 13.3% from 12.1%.
- V2’s Q2 FY27 depreciation and amortisation increased 82% to Rs 68.3 crore, while PAT rose 6% to Rs 18.2 crore.
- V2’s H1FY27 net working-capital days rose to 88 from 45 a year earlier.
powered by IRIS
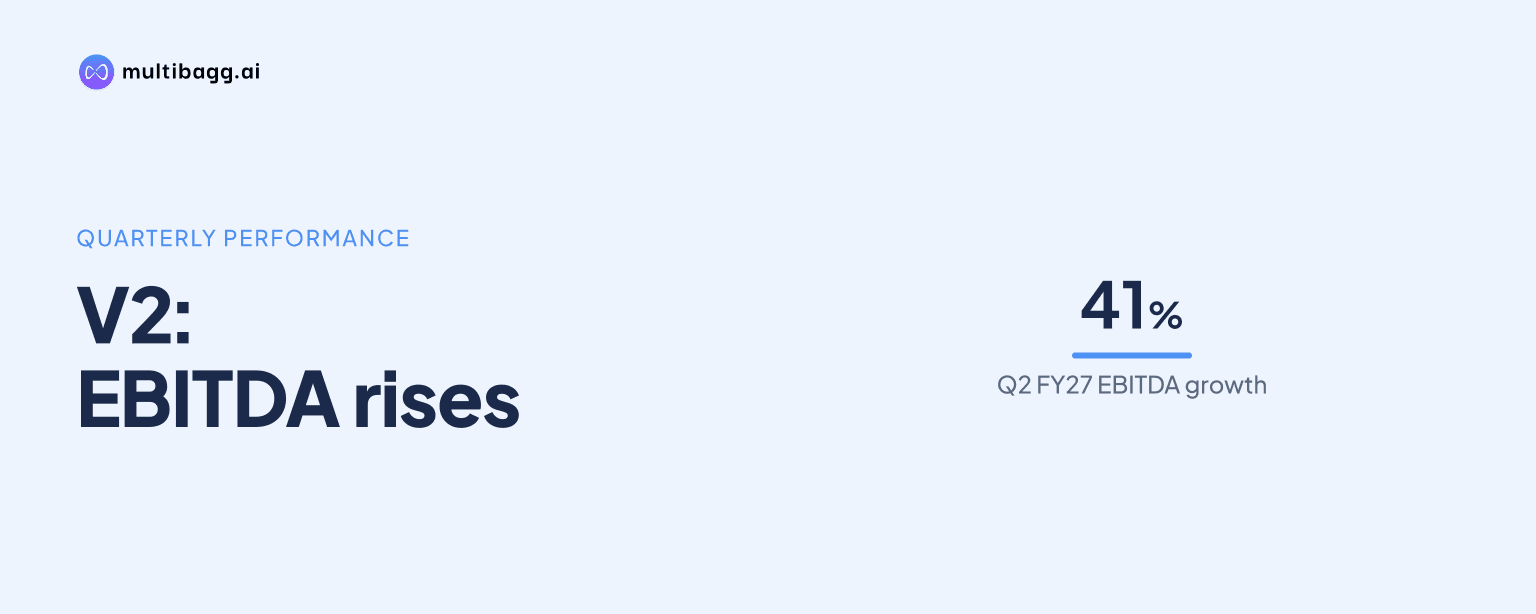
In the second quarter of financial year 2027 (Q2 FY27), V2 Retail’s earnings before interest, tax, depreciation and amortisation (EBITDA) rose 41% to Rs 120.3 crore, while profit after tax (PAT) increased 6% to Rs 18.2 crore. Depreciation and amortisation rose 82% to Rs 68.3 crore as revenue grew 28% to Rs 905.6 crore.
Know V2 Retail inside out
Results, valuation, peers and who's buying, in one view.
How did V2’s Q2 profit trail EBITDA growth?
V2’s EBITDA increased by Rs 34.9 crore year on year in Q2 FY27, while PAT increased by Rs 1 crore. EBITDA reached Rs 120.3 crore from Rs 85.4 crore, lifting its margin to 13.3% from 12.1%. PAT reached Rs 18.2 crore from Rs 17.2 crore, showing that the additional operating profit did not translate proportionately into reported net profit.
V2’s profit before tax (PBT) increased 18% to Rs 24.8 crore, slower than revenue, gross profit and EBITDA. Its PBT margin declined to 2.7% from 3.0%, while PAT margin declined to 2.0% from 2.4%. Sequentially, Q2 FY27 PAT was below the Rs 41.9 crore recorded in Q1 FY27, when the PAT margin was 4.2%.
What reduced V2’s conversion of EBITDA into profit?
V2’s depreciation and amortisation was the principal charge limiting the increase from EBITDA to PBT, rising by Rs 30.7 crore, or 82%, to Rs 68.3 crore in Q2 FY27. That increase was close to the Rs 34.9 crore increase in EBITDA. Finance cost also increased to Rs 29.7 crore from Rs 28 crore, although other income rose to Rs 2.5 crore from Rs 1.1 crore.
V2’s tax charge increased to Rs 6.6 crore from Rs 3.7 crore as PBT rose by Rs 3.9 crore. Employee expense rose to Rs 89.2 crore from Rs 57.5 crore and other expenses rose to Rs 71.9 crore from Rs 55.2 crore, but gross profit increased by Rs 83.1 crore. The reported figures therefore show that depreciation and amortisation was the largest movement after operating profit that narrowed the gain in PAT.
Did V2’s revenue and operating margins improve in Q2?
V2’s revenue and operating margins improved in Q2 FY27. Revenue from operations rose 28% to Rs 905.6 crore, gross profit rose 42% to Rs 281.3 crore and gross margin expanded to 31.1% from 28.0%. Cost of goods sold was Rs 624.3 crore, compared with Rs 510.5 crore in Q2 FY26, increasing more slowly than revenue.
V2 also reported an EBITDA margin of 13.3%, up from 12.1% in Q2 FY26, though below the 14.0% recorded in Q1 FY27. In the first half of financial year 2027 (H1FY27), revenue rose 42% to Rs 1,902.8 crore, gross profit rose 47% to Rs 566.4 crore and EBITDA rose 50% to Rs 259.7 crore. H1FY27 PAT increased 43% to Rs 60.1 crore and its margin rose to 3.2% from 3.1%.
Got a follow-up? Ask IRIS
What does V2’s pre-Ind AS comparison show?
V2’s consolidated pre-Indian Accounting Standards (pre-Ind AS) presentation shows Q2 FY27 EBITDA of Rs 53.4 crore, up 20% year on year, and PAT of Rs 24.2 crore, down 4%. On that basis, EBITDA margin was 5.9%, compared with 6.3% in Q2 FY26, while PAT margin declined to 2.7% from 3.6%. V2 presents these figures alongside its consolidated reported results.
V2’s pre-Ind AS depreciation and amortisation increased to Rs 16 crore from Rs 10.7 crore, while finance cost increased to Rs 8.1 crore from Rs 4.9 crore. Pre-Ind AS PBT rose 6% to Rs 30.8 crore, compared with the 18% increase in reported PBT to Rs 24.8 crore. For H1FY27, pre-Ind AS EBITDA increased 37% to Rs 132.8 crore and PAT increased 33% to Rs 74.3 crore.
What do V2’s operating and cash metrics show?
V2 ended H1FY27 with 427 stores after opening 106 and closing four, with retail area of about 46.3 lakh square feet. Volume grew 43% year on year, while same-store sales growth was negative 3.7%. Sales per square foot per month declined to Rs 785 from Rs 948, although average bill value increased to Rs 917 from Rs 900.
V2’s net working-capital days increased to 88 in H1FY27 from 45 in H1FY26. Inventory days rose to 146 from 124, while creditor days declined to 58 from 80. Cash generated from operations was Rs 18 crore, down from Rs 109.8 crore, after a Rs 261.4 crore working-capital change; net cash used in investing activities was Rs 150.9 crore and financing activities generated Rs 135.3 crore.
Conclusion
V2’s Q2 FY27 results show operating profit rising more quickly than reported net profit. Revenue, gross profit and EBITDA increased 28%, 42% and 41%, respectively, and gross margin expanded by 3.1 percentage points. However, the 82% increase in depreciation and amortisation reduced the benefit at the PBT and PAT levels, with PAT margin declining by 0.4 percentage points to 2.0%.
The next reported measures to watch are the effect of the 106 H1FY27 store openings on sales per square foot and working capital. Sales per square foot per month was Rs 785, down from Rs 948, while net working-capital days reached 88 and operating cash generation fell to Rs 18 crore from Rs 109.8 crore a year earlier.