










Value 360 Communications H1 FY27 Revenue Rises, PAT Turns Loss
Key highlights
- Value 360 Communications reported H1 FY27 consolidated revenue of Rs 53.48 crore, up 61.5% year on year.
- Standalone revenue from operations rose 55.5% to Rs 44.80 crore in H1 FY27.
- Standalone PAT turned to a Rs 4.00 crore loss in H1 FY27 from a Rs 3.53 crore profit a year earlier.
- Standalone EPS moved to negative Rs 5.21 from positive Rs 2.91 in H1 FY26.
powered by IRIS
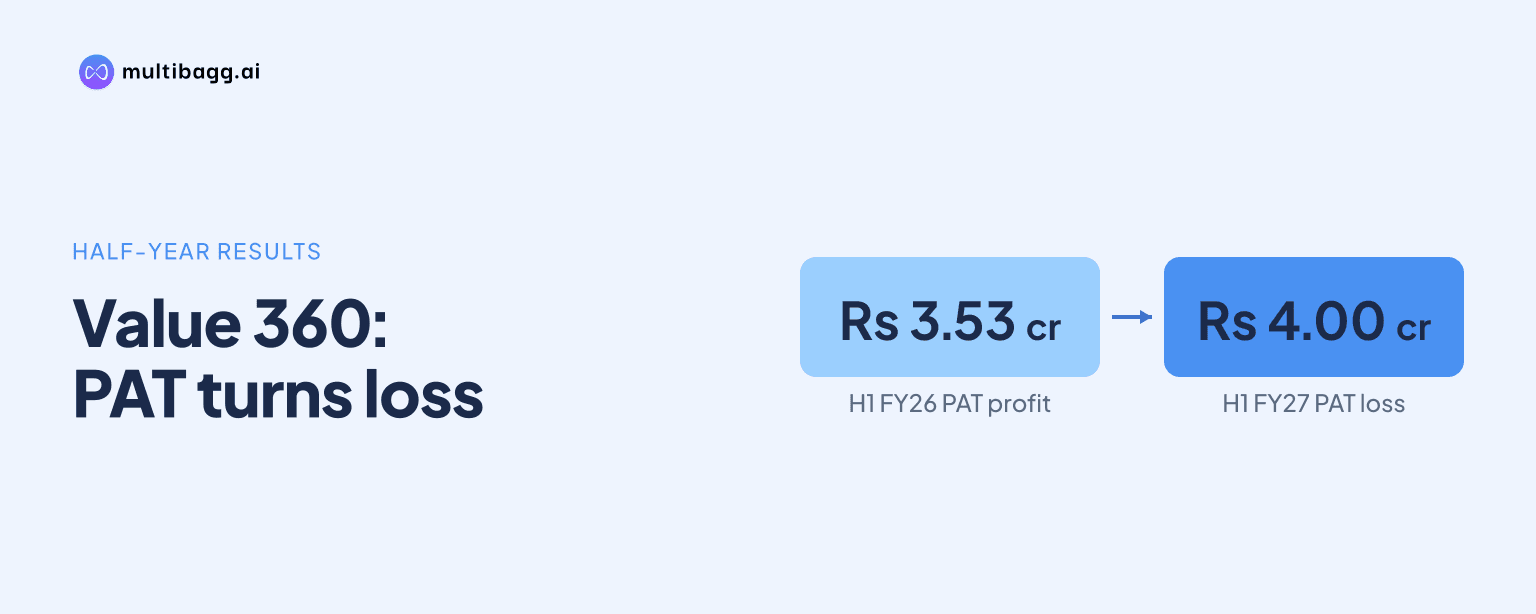
Value 360 Communications Limited reported consolidated revenue from operations of Rs 53.48 crore for the half year ended September 30, 2026, up 61.5% year on year, while standalone profit after tax turned into a Rs 4.00 crore loss from a Rs 3.53 crore profit a year earlier.
Know Value 360 Communications inside out
Results, valuation, peers and who's buying, in one view.
How did Value 360 Communications perform in H1 FY27?
Value 360 Communications recorded strong year-on-year revenue growth during the first half of FY27, based on the reported figures for the period ended September 30, 2026. Standalone revenue from operations was Rs 44.80 crore, compared with Rs 28.80 crore in the corresponding half of the previous year. This represents growth of about 55.5%.
On a consolidated basis, revenue from operations reached Rs 53.48 crore, against Rs 33.12 crore in H1 FY26. The increase of about 61.5% shows that the group generated higher business volumes than in the comparable period last year. Value 360 provides integrated marketing and public relations solutions in India and is listed on the NSE Emerge SME platform.
The figures supplied relate to the half year ended September 30 rather than the September quarter alone. Therefore, the available information supports an H1 comparison and does not establish separate revenue, profit or margin performance for Q2 FY27.
What happened to Value 360 Communications' profit and margins?
Value 360's reported standalone profitability weakened sharply in H1 FY27 despite the increase in revenue. Profit before extraordinary items and tax, used in the available data as a proxy for operating performance, was a loss of Rs 5.31 crore. It had been a profit of Rs 6.23 crore in H1 FY26.
Standalone profit after tax was a loss of Rs 4.00 crore for the six-month period, compared with a profit of Rs 3.53 crore a year earlier. The change amounts to a year-on-year decline of about Rs 7.52 crore. Earnings per share also moved to a loss of Rs 5.21, from positive earnings per share of Rs 2.91 in the corresponding prior-year period.
The source does not provide a separately reported H1 FY27 EBITDA figure or an operating-margin percentage. As a result, an exact EBITDA-margin comparison cannot be calculated from the disclosed H1 data. The reversal from profit to loss, however, indicates that the higher revenue did not translate into reported standalone profitability in the period.
How does H1 FY27 compare with Value 360's FY26 performance?
Value 360's H1 FY27 earnings reversal follows a profitable FY26, when the company reported improved consolidated revenue, EBITDA and PAT. For the year ended March 31, 2026, consolidated revenue from operations was Rs 68.96 crore, up 26.4% from Rs 54.57 crore in FY25.
FY26 consolidated PAT rose 71.6% to Rs 10.02 crore from Rs 5.84 crore in the previous financial year. EBITDA increased 59.9% to Rs 19.17 crore from Rs 11.99 crore, while EBITDA margin expanded to 27.8% from 22.0%. PAT margin improved to 14.5% from 10.7%.
The H1 FY27 revenue base is already substantial relative to the full-year figure reported for FY26, but the two periods should not be treated as directly comparable indicators of full-year performance. The available statement does not provide management commentary explaining the reasons for the H1 loss, nor does it disclose a H1 EBITDA figure.
Got a follow-up? Ask IRIS
What do the H1 figures mean for investors and operations?
The H1 FY27 figures show a clear divergence between revenue growth and reported standalone earnings. For investors, the central issue is not revenue growth alone but the costs, expenses or other factors that contributed to the move from a profit to a loss. The supplied data does not identify those drivers, so no specific cause can be established from the statement.
The difference between standalone and consolidated revenue is also relevant. Consolidated revenue exceeded standalone revenue by Rs 8.69 crore in H1 FY27, reflecting revenue included at the group level. However, consolidated PAT for H1 FY27 has not been provided, preventing a direct comparison between standalone and consolidated bottom-line performance for the half year.
For the communications and marketing services business, client acquisition, service mix and cost discipline can affect margins alongside revenue. Value 360's FY26 results had cited better cost management and client acquisitions alongside higher revenue and margin expansion. The H1 FY27 statement, by contrast, provides no operational explanation for the loss, making subsequent disclosures important for assessing whether the pressure is temporary or persistent.
What should shareholders monitor after the H1 FY27 update?
Shareholders should monitor whether Value 360 can restore profitability while sustaining its higher revenue base. The reported standalone loss before tax of Rs 5.31 crore and PAT loss of Rs 4.00 crore contrast with the company's profitable FY26 consolidated results and make the next set of financial disclosures significant.
Investors may also watch for separate quarterly data, consolidated profitability details, EBITDA disclosure and any management explanation of changes in expenses or business mix. These items would help clarify the gap between H1 revenue growth and the negative standalone earnings outcome. The current information does not contain a forward guidance statement, target or announced operational plan.
Conclusion
Value 360 delivered year-on-year growth in both standalone and consolidated revenue in H1 FY27, with consolidated revenue rising to Rs 53.48 crore. Yet the period also marked a significant earnings reversal at the standalone level, where PAT shifted from a Rs 3.53 crore profit to a Rs 4.00 crore loss and EPS turned negative.
The next results disclosure will be important for evidence on profitability, including any separate Q2 figures, consolidated earnings data and management's explanation for the higher costs or other factors behind the loss. Until then, the available statement establishes revenue growth but does not explain the decline in margins and profit.