










Vikran H1 consolidated PAT drops to Rs 6.7 crore after eliminations
Key highlights
- Vikran reported H1 FY27 consolidated PAT of Rs 6.7 crore versus standalone PAT of Rs 25.4 crore.
- A Rs 70.7 crore intra-group EPC revenue elimination reduced H1 FY27 consolidated revenue to Rs 353.4 crore.
- Consolidated H1 FY27 EBITDA was Rs 33.5 crore, Rs 14.6 crore below standalone EBITDA of Rs 48.1 crore.
- NOPL has planned capacity of 969 megawatts alternating current, and management projects annual revenue of more than Rs 525 crore upon commissioning.
powered by IRIS
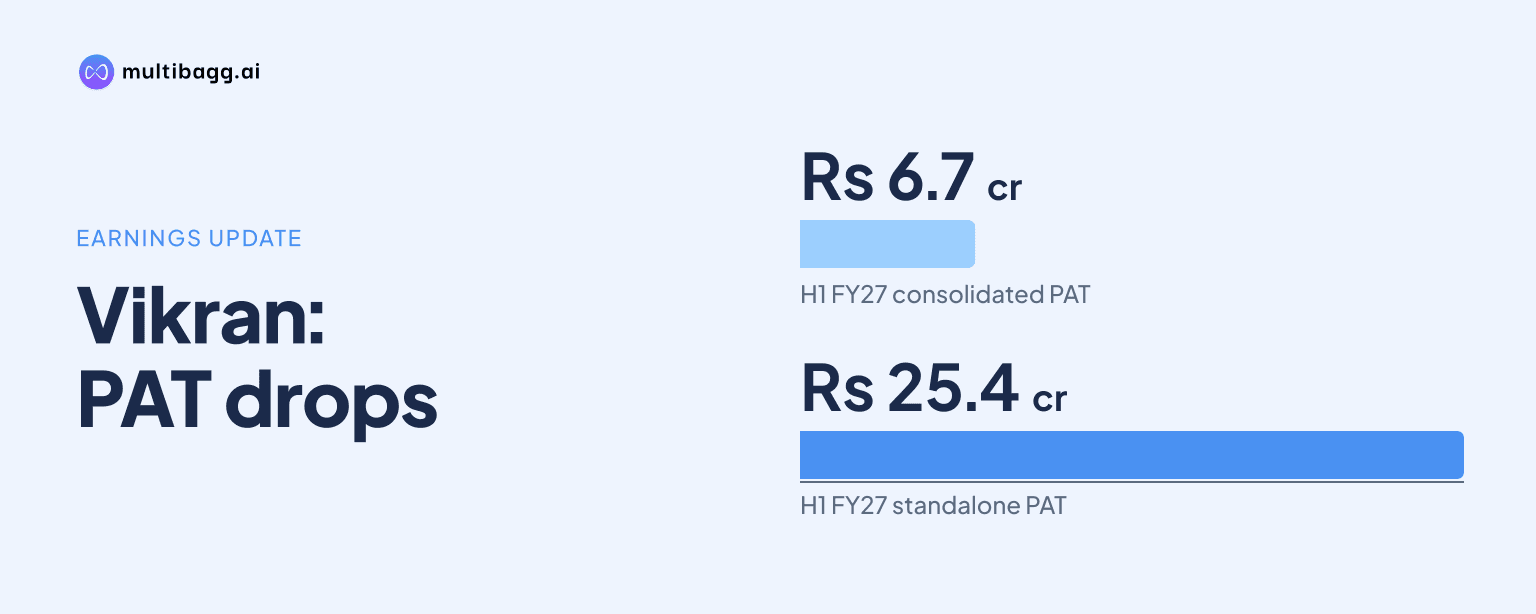
Vikran Engineering Limited reported H1 FY27 consolidated profit after tax (PAT) of Rs 6.7 crore, compared with standalone PAT of Rs 25.4 crore, after eliminating Rs 18.7 crore of intra-group project profit on engineering, procurement and construction (EPC) work performed for wholly owned NOPL.
Know Vikran Engineering inside out
Results, valuation, peers and who's buying, in one view.
Why was Vikran’s H1 FY27 consolidated PAT Rs 6.7 crore?
Vikran’s consolidated PAT was Rs 6.7 crore because Indian Accounting Standards (Ind AS) require revenue and profit on transactions within a group to be eliminated in consolidated accounts. The presentation identifies Rs 18.7 crore of eliminated internal profit and corresponding tax adjustments as the difference between standalone PAT of Rs 25.4 crore and consolidated PAT of Rs 6.7 crore in H1 FY27.
The effect extended beyond the final profit line in H1 FY27. Vikran reported standalone revenue from operations of Rs 424.1 crore, while consolidated revenue was Rs 353.4 crore after a Rs 70.7 crore elimination of EPC revenue billed internally to NOPL. Vikran says it executes EPC work for wholly owned NOPL, so that work cannot be recognised as external group revenue in consolidation.
Vikran characterises the adjustment as an accounting elimination rather than a loss of the underlying project value. The presentation says internal EPC value is capitalised into the renewable asset base, while the internal margin is eliminated in consolidation. Consolidated earnings per share were Rs 0.26 in H1 FY27, compared with Rs 0.98 in the standalone accounts, a difference of Rs 0.72.
How do Vikran’s standalone and consolidated H1 FY27 results compare?
Vikran’s H1 FY27 consolidated result was below its standalone result on each principal profit measure after intra-group elimination. Revenue was lower by Rs 70.7 crore, earnings before interest, tax, depreciation and amortisation (EBITDA) by Rs 14.6 crore, profit before tax by Rs 25 crore and PAT by Rs 18.7 crore.
The margin comparison shows that the difference was not limited to reported revenue. Standalone EBITDA margin was 11.4% in H1 FY27, compared with 9.5% on a consolidated basis, while PAT margin was 6.0% standalone and 1.9% consolidated. Vikran attributes the 1.9-percentage-point EBITDA-margin difference to temporary overhead absorption without external top-line recognition, and attributes the 4.1-percentage-point PAT-margin difference to eliminated internal profit and tax adjustments.
How did Vikran’s H1 FY27 performance change from H1 FY26?
Vikran’s standalone revenue increased faster than its consolidated revenue in H1 FY27. Standalone revenue from operations rose 26.5% year on year to Rs 424.1 crore from Rs 335.4 crore in H1 FY26, while consolidated revenue increased 5.4% to Rs 353.4 crore from Rs 335.5 crore. The H1 FY27 standalone figure includes the Rs 70.7 crore intra-group EPC revenue eliminated in consolidation.
The profit trends also differed across the two reporting bases. Standalone PAT increased 71.6% to Rs 25.4 crore in H1 FY27 from Rs 14.8 crore in H1 FY26, whereas consolidated PAT declined 54.4% to Rs 6.7 crore from Rs 14.8 crore. The identical H1 FY26 PAT figures contrast with the Rs 18.7 crore H1 FY27 elimination disclosed for NOPL project work.
EBITDA followed a similar pattern. Standalone EBITDA was broadly unchanged at Rs 48.1 crore in both H1 FY27 and H1 FY26, although its margin declined to 11.4% from 14.3%. Consolidated EBITDA declined 30.3% to Rs 33.5 crore from Rs 48.1 crore, and consolidated EBITDA margin fell to 9.5% from 14.3%.
Got a follow-up? Ask IRIS
What happens to the eliminated NOPL EPC value next?
Vikran says the eliminated EPC value is being capitalised into NOPL’s renewable asset base during construction rather than recognised immediately as consolidated turnover or profit. Consolidated property, plant and equipment stood at Rs 188.1 crore in September 2026, up from Rs 10.8 crore in March 2026, while capital work-in-progress was Rs 739.9 crore against nil at March 2026.
Management’s stated plan is for NOPL to move from construction to electricity generation. The project covers 152 locations in Maharashtra and has planned capacity of 969 megawatts alternating current. An Indian Renewable Energy Development Agency (IREDA) term-loan facility of up to Rs 2,941.19 crore carries a 9.15% interest rate, with disbursements aligned to execution across eight project clusters.
Vikran also reports that more than 80% of project land has been secured and that it has more than 100 installation partners. The presentation describes a 25-year power-purchase-agreement framework at a Maharashtra State Electricity Distribution Company Limited (MSEDCL) tariff of Rs 3.074 per kilowatt-hour. These details describe the planned operating structure rather than reported H1 FY27 generation income.
What does management project after NOPL commissioning?
Management projects that the renewable generation portfolio could produce annual run-rate revenue of more than Rs 525 crore upon commissioning. It also presents an EBITDA-margin profile of 85% to 88% for the renewable generation portfolio, which is a management projection and not a reported H1 FY27 margin.
Vikran’s performance bridge places a 12-month execution phase between Q2 FY27 and Q2 FY28 and says consolidated figures should inflect as NOPL assets approach commissioning and generation becomes material. The presentation further says FY27 consolidation masks EPC economics, while FY28 could show both asset capitalisation and renewable annuity economics. It does not provide a confirmed commissioning date.
Conclusion
Vikran’s H1 FY27 figures distinguish parent-level EPC activity from reported group earnings. Standalone revenue reached Rs 424.1 crore and PAT was Rs 25.4 crore, but Ind AS eliminations of Rs 70.7 crore of revenue and Rs 18.7 crore of PAT reduced consolidated revenue to Rs 353.4 crore and consolidated PAT to Rs 6.7 crore.
The next disclosed milestone is progress through the 12-month execution phase toward the Q2 FY28 point identified in Vikran’s bridge. Investors can monitor execution of the 969-megawatt portfolio, disbursements under the Rs 2,941.19 crore IREDA facility, and whether commissioning enables the projected annual renewable revenue run-rate of more than Rs 525 crore.