










Viyash H1 PAT rises 49% as net debt falls to Rs 26.1 crore
Key highlights
- Viyash reported H1 FY27 revenue of Rs 1,934.3 crore, up 17.8% year on year.
- Viyash’s H1 FY27 PAT increased 49.4% to Rs 163.9 crore.
- Viyash’s net debt fell to Rs 26.1 crore at Q2 FY27 from Rs 409.5 crore in H1 FY26.
- Viyash’s formulations revenue rose 26% to Rs 1,113.4 crore in H1 FY27.
powered by IRIS
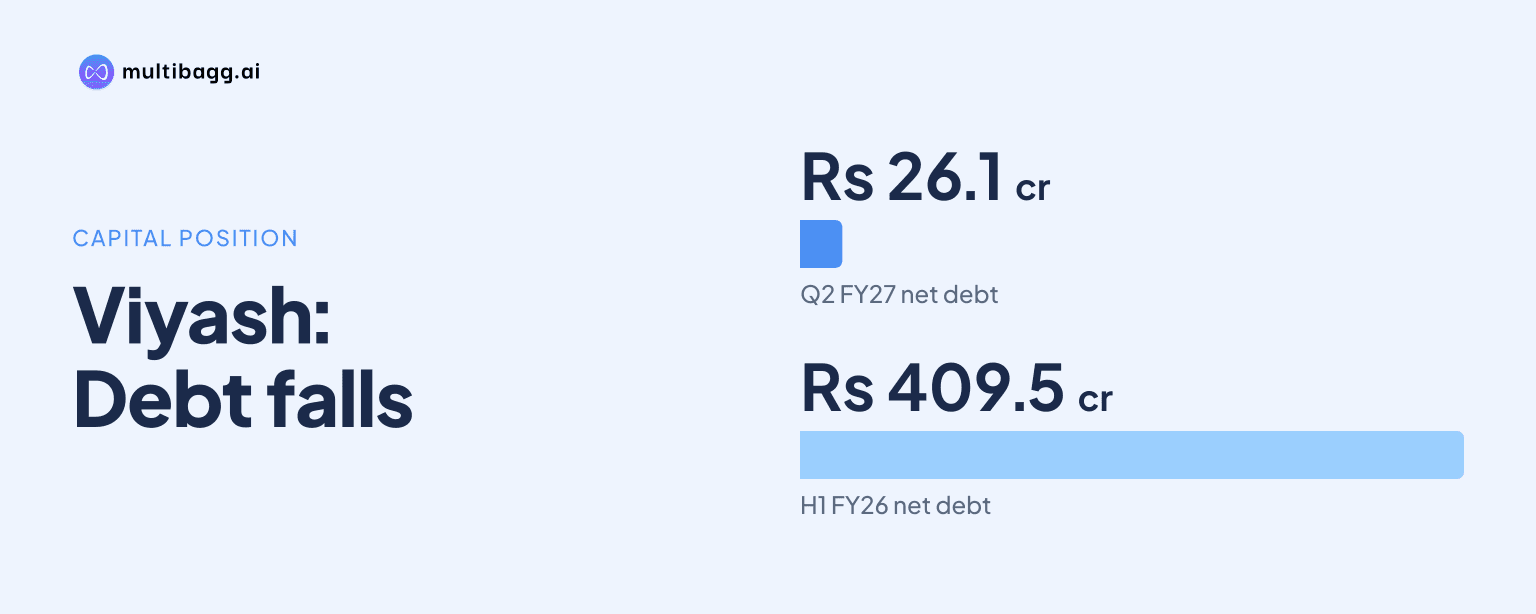
Viyash Scientific Limited reported H1 FY27 profit after tax of Rs 163.9 crore, up 49.4% year on year, while net debt fell to Rs 26.1 crore at Q2 FY27 from Rs 409.5 crore in H1 FY26. Revenue from operations increased 17.8% to Rs 1,934.3 crore and EBITDA before employee stock option plan cost rose 29.9%.
Know Viyash Scientific inside out
Results, valuation, peers and who's buying, in one view.
How did Viyash perform in H1 FY27?
Viyash recorded Rs 1,934.3 crore in H1 FY27 revenue from operations, compared with Rs 1,641.9 crore in H1 FY26, while EBITDA before employee stock option plan, or ESOP, cost increased to Rs 412.4 crore from Rs 317.6 crore. EBITDA margin increased by 200 basis points to 21.3% from 19.3%, with one basis point equal to one-hundredth of a percentage point.
Profit growth outpaced sales growth in the half year. Earnings before tax rose 52.7% to Rs 230.1 crore from Rs 150.7 crore, and PAT rose to Rs 163.9 crore from Rs 109.8 crore. Gross margin was 53.9%, compared with 53.8% in H1 FY26, while gross margin in value terms increased 18.1% to Rs 1,042.6 crore.
Viyash also reported a higher ESOP charge in the half. ESOP cost was Rs 66.7 crore in H1 FY27, versus Rs 23 crore in H1 FY26, which the company attributed to incremental grants under its scheme of amalgamation. Management said adjusted H1 PAT was Rs 204 crore, assuming a normalised annual ESOP cost of Rs 25 crore.
Why did Viyash’s H1 profit grow faster than revenue?
Viyash’s H1 PAT grew faster than revenue because EBITDA, other income and lower finance and depreciation costs lifted earnings before tax by 52.7%. Finance cost declined to Rs 26.2 crore from Rs 37.9 crore, depreciation fell to Rs 107.1 crore from Rs 114.7 crore, and other income increased to Rs 20.7 crore from Rs 8.8 crore.
Costs below gross profit rose more slowly than revenue on the reported comparison. Employee benefit expenses increased 10.1% to Rs 280.8 crore and operating expenses rose 10.6% to Rs 348.8 crore, against 17.8% revenue growth. Material consumption increased to Rs 891.7 crore from Rs 759 crore, while the gross-margin percentage was almost unchanged at 53.9%.
The half-year results also included a change in exchange movement and a higher tax charge. Viyash reported an exchange loss of Rs 0.6 crore in H1 FY27, compared with an exchange gain of Rs 4.9 crore in H1 FY26, while taxes rose to Rs 66.2 crore from Rs 41 crore. Despite those movements and the increased ESOP cost, earnings before tax and PAT both rose faster than sales.
What changed in Viyash’s Q2 FY27 result?
Viyash reported Q2 FY27 revenue of Rs 987.9 crore, up 16.2% year on year and 4.4% sequentially from Rs 946.4 crore in Q1 FY27. Q2 EBITDA before ESOP cost increased 10.3% year on year to Rs 207.7 crore and was 1.4% above the Rs 204.7 crore reported in Q1 FY27.
Quarterly EBITDA margin was 21.0%, down from 22.1% in Q2 FY26 and 21.6% in Q1 FY27. Gross margin was 53.7%, compared with 55.5% a year earlier and 54.1% in the preceding quarter. Gross margin in value terms nevertheless rose 12.4% year on year to Rs 530.5 crore from Rs 471.9 crore.
Q2 PAT was Rs 84.7 crore, up 16.1% from Rs 72.9 crore in Q2 FY26 and 6.8% from Rs 79.3 crore in Q1 FY27. ESOP cost was Rs 42.1 crore in Q2, compared with Rs 10 crore a year earlier, while finance cost decreased to Rs 13.7 crore from Rs 17.5 crore. The company also cited increased animal-health research and development investment to support new companion-animal products.
Got a follow-up? Ask IRIS
Which businesses contributed to Viyash’s sales growth?
Viyash’s formulations business grew faster than its active pharmaceutical ingredients, or API, business in H1 FY27. Formulations revenue rose 26% to Rs 1,113.4 crore from Rs 885.8 crore, while API revenue increased 8% to Rs 798.7 crore from Rs 741.3 crore. Other sales were Rs 19.3 crore, compared with Rs 15.3 crore.
India was the fastest-growing reported formulations geography in the half, with revenue rising 49% to Rs 93.4 crore from Rs 62.5 crore. Emerging Markets grew 39% to Rs 403.8 crore, Europe increased 16% to Rs 371.1 crore, and United States formulations sales rose 15% to Rs 245.1 crore.
In Q2 FY27, formulations revenue increased 19% year on year to Rs 558.7 crore and API revenue rose 12% to Rs 415.4 crore. United States formulations revenue declined 11% year on year in the quarter to Rs 118.9 crore, compared with Rs 133.7 crore in Q2 FY26. This quarterly decline contrasted with the 15% increase in first-half United States formulations revenue.
How far has Viyash reduced debt and what plans has management disclosed?
Viyash reduced net debt to Rs 26.1 crore at Q2 FY27 from Rs 86.1 crore in Q1 FY27 and Rs 409.5 crore in H1 FY26. Net debt to last-twelve-month EBITDA, calculated using EBITDA before ESOP cost, was 0.0 times at Q2 FY27, versus 0.1 times in Q1 FY27 and 0.7 times in H1 FY26.
The presentation shows a longer decline in the net-debt-to-EBITDA measure, from 1.4 times in both Q1 FY25 and Q2 FY25 to 0.2 times in Q4 FY26. It then fell from 0.1 times in Q1 FY27 to 0.0 times in Q2 FY27. The presentation does not provide gross debt, cash balances or a cash-flow statement explaining the components of the net-debt movement.
Management said Viyash is investing in new oncology capabilities, an in-house companion-animal manufacturing facility and expanded API capacity to meet customer demand. Viyash completed its acquisition of BioForLife in Italy on October 1, 2026, following execution of the share purchase agreement on July 21, 2026. The company said BioForLife has a companion-animal portfolio of 85 to 90 products and a salesforce with 85% veterinary-clinic coverage in Italy.
Conclusion
Viyash’s first-half results show profit growth exceeding revenue growth, with EBITDA before ESOP cost rising 29.9% and PAT increasing 49.4% on 17.8% higher revenue. Formulations, which grew 26%, expanded faster than APIs at 8%, while the reported net-debt balance declined substantially over the year.
The next items to watch are management’s execution of investments in oncology, companion-animal manufacturing and API capacity, as well as the integration of BioForLife after its October 1, 2026 completion. Quarterly EBITDA margin, which was 21.0% in Q2 FY27 against 22.1% a year earlier, is also a disclosed measure relevant to tracking those plans.