










WABAG international revenue reaches 54% of H1 FY27 total
Key highlights
- WABAG's international revenue rose 38% to Rs 1,007 crore in H1 FY27 and accounted for 54% of total revenue.
- India revenue increased 5% to Rs 861.2 crore in H1 FY27, reducing its revenue mix to 46%.
- International EPC revenue grew 40% to Rs 926.5 crore and represented 60% of EPC revenue.
- WABAG's H1 FY27 closing backlog was Rs 20,207.1 crore, with India accounting for 56% and international markets 44%.
powered by IRIS
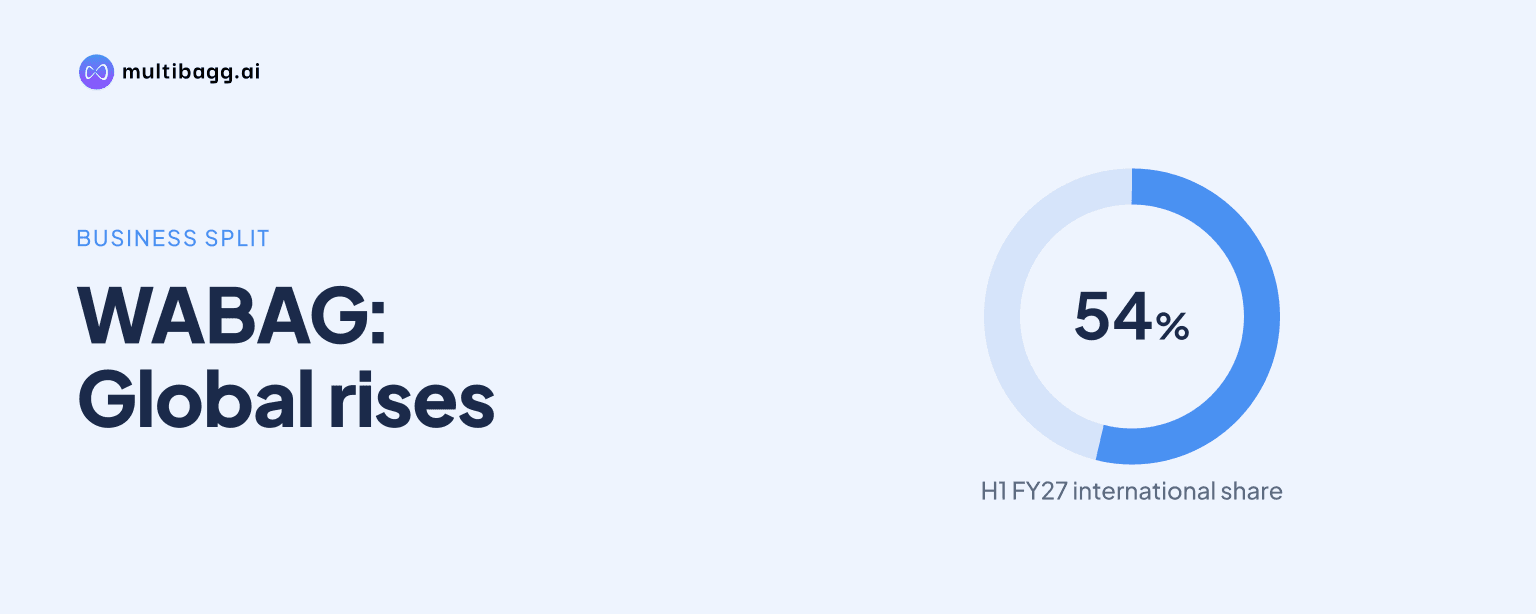
VA Tech Wabag Ltd. reported international revenue of Rs 1,007 crore in H1 FY27, up 38% year on year and equal to 54% of total revenue, compared with India’s 46% share. WABAG’s overseas engineering, procurement and construction, or EPC, revenue rose 40% to Rs 926.5 crore, while Indian EPC revenue increased 2%.
Know Va Tech Wabag inside out
Results, valuation, peers and who's buying, in one view.
How did WABAG's international revenue overtake India?
WABAG generated Rs 1,007 crore from international markets in the first half of FY27, compared with Rs 728 crore in H1 FY26. This Rs 279 crore increase lifted international revenue’s share of the Rs 1,868.2 crore total to 54%, from 47% a year earlier. India contributed Rs 861.2 crore, or 46% of H1 FY27 revenue, after contributing Rs 820.9 crore, or 53%, in H1 FY26.
The geographic change reflected different growth rates rather than a fall in domestic revenue. India revenue increased 5% year on year, adding Rs 40.3 crore, while international revenue increased 38%, adding Rs 279 crore. Total H1 revenue increased 21%, from Rs 1,548.9 crore to Rs 1,868.2 crore, with international operations accounting for most of the absolute increase.
Which business line drove WABAG's geographic revenue shift?
WABAG's EPC business drove the geographic shift because overseas EPC revenue grew 40% to Rs 926.5 crore in H1 FY27. International EPC revenue was Rs 659.6 crore in H1 FY26 and represented 52% of EPC revenue; its share increased to 60% in H1 FY27. Indian EPC revenue rose 2% to Rs 611.6 crore, reducing its EPC mix from 48% to 40%.
EPC accounted for Rs 1,538.1 crore, or 82%, of WABAG's H1 FY27 revenue, up 22% from Rs 1,257 crore in H1 FY26. Operations and maintenance, or O&M, produced Rs 330.1 crore and grew 13% from Rs 291.9 crore. EPC's revenue mix consequently increased by one percentage point from 81% to 82%, making overseas EPC the principal contributor to the change in geographic mix.
International O&M revenue also increased, but from a smaller base. Overseas O&M revenue rose 18% to Rs 80.5 crore from Rs 68.4 crore, while Indian O&M revenue increased 12% to Rs 249.6 crore from Rs 223.5 crore. India remained the larger O&M market at 76% of segment revenue, while international operations accounted for 24%, unlike the 60% international share in EPC.
Got a follow-up? Ask IRIS
How did WABAG's customer mix change in H1 FY27?
WABAG's municipal business remained its largest customer segment, generating Rs 1,472.2 crore in H1 FY27, or 79% of revenue. Municipal revenue increased 23% from Rs 1,195.3 crore in H1 FY26, while industrial revenue increased 12% to Rs 396 crore from Rs 353.6 crore. Faster municipal growth increased its mix by two percentage points, while industrial's mix declined from 23% to 21%.
Municipal EPC revenue rose 25% to Rs 1,198.7 crore in H1 FY27 from Rs 956.3 crore and accounted for 78% of EPC revenue. Industrial EPC revenue increased 13% to Rs 339.3 crore from Rs 300.7 crore, representing 22% of EPC revenue. Within O&M, municipal revenue was Rs 273.4 crore, or 83% of the segment, compared with Rs 56.7 crore from industrial customers.
The presentation does not provide a geography-by-customer cross-tabulation. It shows separately that international revenue was Rs 1,007 crore, EPC revenue was Rs 1,538.1 crore, and municipal revenue was Rs 1,472.2 crore in H1 FY27. Those figures establish the business and customer concentrations without assigning municipal or industrial revenue specifically to international projects.
What does WABAG's backlog say about geographic mix?
WABAG ended H1 FY27 with closing order backlog of Rs 20,207.1 crore, up 37% from Rs 14,764.3 crore in H1 FY26. India represented Rs 11,257.3 crore, or 56%, after 48% growth, while international backlog was Rs 8,949.8 crore, or 44%, after 25% growth. The closing backlog was therefore more India-weighted than H1 revenue, which was 54% international.
EPC represented Rs 13,697.4 crore, or 68%, of closing backlog after rising 49% from Rs 9,210.1 crore. O&M backlog rose 17% to Rs 6,509.8 crore, but its share declined from 38% to 32%. The EPC backlog concentration corresponds with EPC's 82% share of H1 FY27 revenue and the 40% increase in international EPC revenue.
Order intake in H1 FY27 was marginally international-led, at Rs 2,671.3 crore internationally and Rs 2,519.5 crore in India, from total intake of Rs 5,190.8 crore. International orders represented 51% of intake, while India accounted for 49%. The disclosed orders included a 272 million litres per day seawater reverse-osmosis project at Doha, Kuwait, an 86 million litres per day water treatment plant at Vienna, Austria, and a 60 million litres per day sewage treatment plant at Ajman, UAE; the intake data exclude framework orders.
Conclusion
WABAG's H1 FY27 revenue mix shifted towards international markets because overseas revenue grew 38%, compared with 5% in India, taking the international share to 54% of Rs 1,868.2 crore revenue. Overseas EPC revenue rose 40% to Rs 926.5 crore, while municipal work remained the largest customer segment at 79% of total revenue.
The next issue is the pace of project execution across geographies. International markets supplied 51% of H1 FY27 order intake of Rs 5,190.8 crore, but India accounted for 56% of the Rs 20,207.1 crore closing backlog, so future revenue mix depends on execution timing within EPC and O&M projects.