


Earnings Call/Transcript
Chandan Healthcare Schedules Q2 FY27 Earnings Call
Chandan Healthcare will hold a post-earnings conference call on November 18, 2026, at 12:00 PM IST to discuss its Q2 and H1 FY27 financial results.





IRIS
Multibagg AI is an AI powered stock research and analysis platform. We provide data, information, content, and analytics for publicly traded Indian companies listed on NSE and BSE. AI can make mistakes, check important information.
Prices might be delayed by a few minutes.
Join our Exclusive Community


Join our Exclusive Community
Made with 💙 in India. © Finsky Technologies Pvt Ltd. 2026


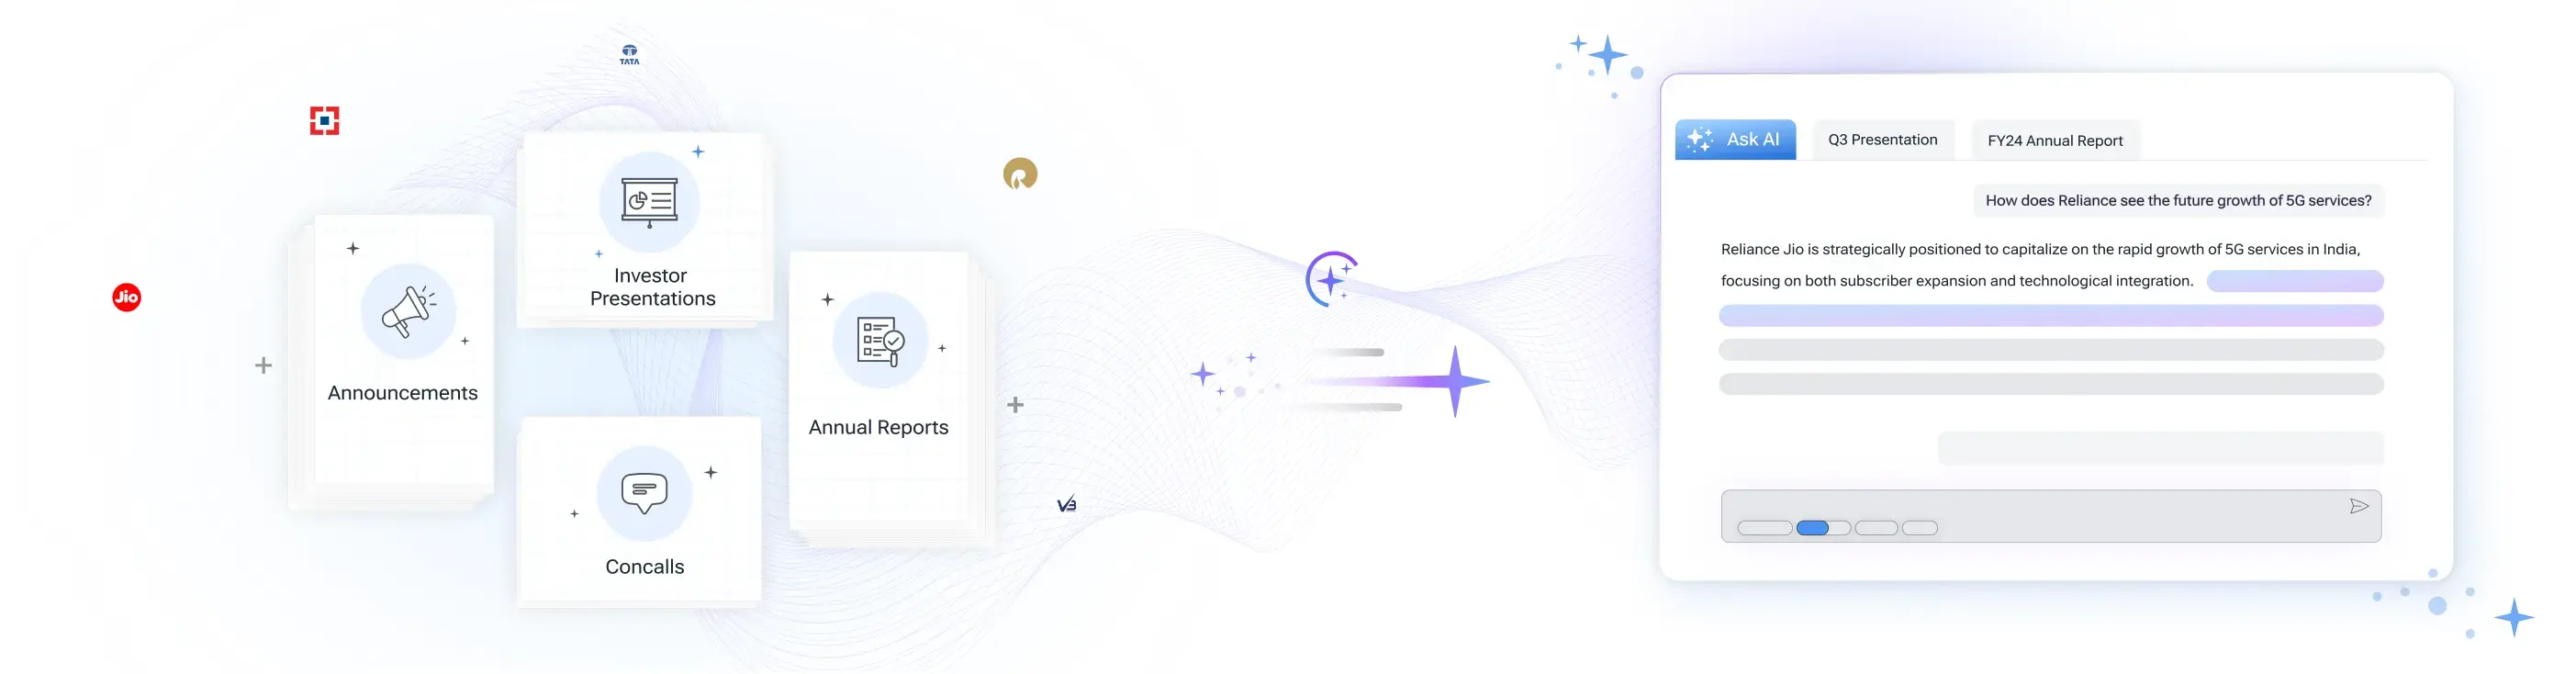
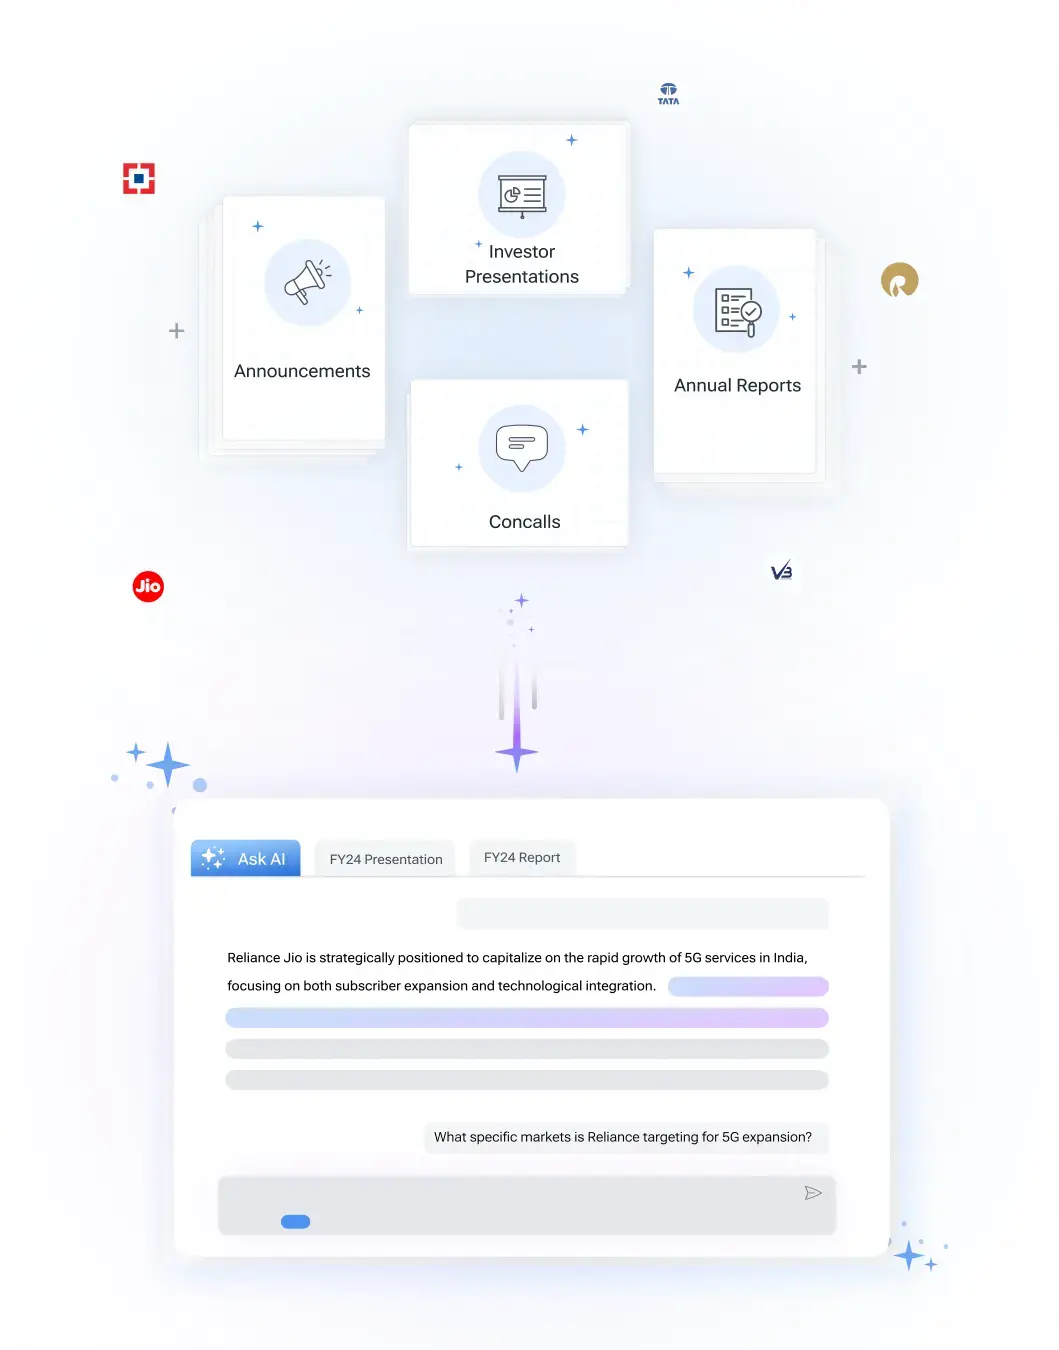
Get instant AI-powered insights about company performance, financials, and strategy. Ask questions about trends, competition, and developments while receiving responses backed by official documents and market data, with clear attribution to source documents.

 Discovery themes featuring this stock
Bearish
3
Neutral
8
Bullish
3
Bearish
14
Neutral
8
Bullish
24
Bearish
11
Neutral
0
Bullish
21
Bearish
11
Neutral
0
Bullish
21
Bearish
11
Neutral
0
Bullish
21
Bearish
11
Neutral
0
Bullish
21



Investor Presentation
Q1 FY27
Investor Presentation
Q4 FY26
Investor Presentation
Q3 FY26
Investor Presentation
Q2 FY26
Investor Presentation
Q2 FY26
Investor Presentation
Q4 FY25
View Standalone
View Standalone
View Standalone
View Standalone
View Standalone
View Standalone
View Standalone
View Standalone



Chandan Healthcare is an India-based diagnostics operator running pathology and radiology services through company-owned centers, central referral labs and a rapidly growing franchise and partnership network across multiple states; the company provides a wide test menu, NABL/NABH accreditations, and tertiary-care linkages via group hospitals and institutional collaborations.
The company reported consolidated Q1 FY27 revenue of INR82.26 crores (up 19.6% YoY), EBITDA of INR20.98 crores (up 42.3%) and PAT of INR7.5 crores (up 29%), while standalone diagnostics grew 35.9% with 36.6% EBITDA margin, signalling strong operating leverage within Chandan Healthcare’s core diagnostic business.
Chandan Healthcare is rapidly scaling a capital-light franchise model: management added 134 franchises in a single quarter, reached roughly 375 franchises within months, and targets 1,000 franchises this year and 3,000 within two years, underscoring an aggressive expansion that leverages local phlebotomists to extend reach while minimizing corporate capex.
Management has re-focused the group by divesting the lower-margin pharmacy trading business for ~INR16.77 crores to concentrate capital and management attention on higher-margin diagnostics; Chandan Healthcare will re-deploy proceeds into diagnostic assets and network expansion to accelerate growth and margin improvement.
Service-mix traction shows very strong B2B growth (94% YoY), steady B2G (22% YoY) and B2C (20% YoY) expansion, with pathology contributing ~74% of diagnostics revenue and radiology ~26%, while new specialty offerings (genome lab, PET scans) and government contracts are positioned to broaden revenue streams for Chandan Healthcare.
Healthcare Services
Healthcare Service Provider
576 Cr
Low Risk
20.4
59.7
0.3
3.4
358.00
185.40
Sales CAGR
Profit CAGR
ROE
ROCE

| Symbol | Watchlist | Price | Market Cap | P/E | P/B | Div Yield (%) | ROE (%) | ROCE (%) | ROA (%) |
272.30 | 866 Cr | -37.11 | 1.35 | 0.00 | 0.30 | -0.07 | -2.78 | ||
397.30 | 776 Cr | 12.43 | 4.74 | 0.00 | 38.11 | 50.85 | 23.80 | ||
105.95 | 771 Cr | 33.27 | 4.73 | 0.00 | 14.21 | 18.21 | 11.57 | ||
409.00 | 745 Cr | 29.24 | 5.41 | 0.00 | 17.95 | 19.36 | 14.00 | ||
282.95 | 591 Cr | 54.51 | 3.74 | 0.00 | 0.00 | 0.00 | 5.25 | ||
235.55 | 576 Cr | 20.42 | 3.39 | 0.00 | 11.34 | 20.76 | 7.42 | ||
105.35 | 232 Cr | 13.37 | 2.00 | 0.00 | 32.69 | 34.65 | 0.00 | ||
| Median: 7 Co. | — | 272.30 | 745 Cr | 20.42 | 3.74 | 0.00 | 14.21 | 19.36 | 7.42 |
Chandan Healthcare Ltd (CHANDAN) is currently trading at 235.55 per share. Stock prices fluctuate during market hours on NSE and BSE based on demand, company updates, and overall market conditions. Refer to the live price chart above for the most recent price movement.
Chandan Healthcare is an India-based diagnostics operator running pathology and radiology services through company-owned centers, central referral labs and a rapidly growing franchise and partnership network across multiple states; the company provides a wide test menu, NABL/NABH accreditations, and tertiary-care linkages via group hospitals and institutional collaborations. The company reported consolidated Q1 FY27 revenue of INR82.26 crores (up 19.6% YoY), EBITDA of INR20.98 crores (up 42.3%) and PAT of INR7.5 crores (up 29%), while standalone diagnostics grew 35.9% with 36.6% EBITDA margin, signalling strong operating leverage within Chandan Healthcare’s core diagnostic business. Chandan Healthcare is rapidly scaling a capital-light franchise model: management added 134 franchises in a single quarter, reached roughly 375 franchises within months, and targets 1,000 franchises this year and 3,000 within two years, underscoring an aggressive expansion that leverages local phlebotomists to extend reach while minimizing corporate capex. Management has re-focused the group by divesting the lower-margin pharmacy trading business for ~INR16.77 crores to concentrate capital and management attention on higher-margin diagnostics; Chandan Healthcare will re-deploy proceeds into diagnostic assets and network expansion to accelerate growth and margin improvement. Service-mix traction shows very strong B2B growth (94% YoY), steady B2G (22% YoY) and B2C (20% YoY) expansion, with pathology contributing ~74% of diagnostics revenue and radiology ~26%, while new specialty offerings (genome lab, PET scans) and government contracts are positioned to broaden revenue streams for Chandan Healthcare.
Over the past 52 weeks, Chandan Healthcare Ltd has traded between a low of ₹185.40 and a high of ₹358.00. The 52-week high and low indicate the stock’s price range over the last year and help investors understand its volatility and recent trading levels.
Chandan Healthcare Ltd has a market capitalization of approximately 575.97. Market capitalization represents the total value of a company’s outstanding shares and helps investors understand its size, stability, and relative risk compared to other listed companies.
Chandan Healthcare Ltd’s investment profile depends on its business fundamentals, valuation, and long-term outlook. The stock currently trades at a PE ratio of 20.42 and operates in the its sector sector. Investors typically assess financial performance, growth prospects, and individual risk tolerance before making investment decisions.
Based on its market capitalization of 575.97 Cr, Chandan Healthcare Ltd is classified as a Small Cap stock. Large-cap stocks are generally more stable, while mid-cap and small-cap stocks tend to offer higher growth potential along with higher price volatility.
Chandan Healthcare Ltd operates in the its sector sector. Sector classification matters because companies in the same sector are often affected by similar economic conditions, regulatory changes, and competitive dynamics, which can influence overall stock performance.
The Price-to-Earnings (PE) ratio of Chandan Healthcare Ltd is 20.42. The PE ratio compares a company’s share price to its earnings and is commonly used to assess valuation. Comparing the PE ratio with sector peers and historical levels provides better context.
The company disclosed it is divesting its entire 53.56% shareholding in Chandan Pharmacy Limited to Chandan Hospital Limited, after which CPL will cease to be a subsidiary.