Actions
Action Type





Welcome to Multibagg AI
Log in to access personalized features
IRIS
Multibagg AI is an AI powered stock research and analysis platform. We provide data, information, content, and analytics for publicly traded Indian companies listed on NSE and BSE. AI can make mistakes, check important information.
Prices might be delayed by a few minutes.
Join our Exclusive Community


Join our Exclusive Community
Made with 💙 in India. © Finsky Technologies Pvt Ltd. 2026


Get instant AI-powered insights about company performance, financials, and strategy. Ask questions about trends, competition, and developments while receiving responses backed by official documents and market data, with clear attribution to source documents.





 Discovery themes featuring this stock
Bearish
3
Neutral
7
Bullish
4
Bearish
23
Neutral
7
Bullish
16
Bearish
20
Neutral
0
Bullish
12
Bearish
20
Neutral
0
Bullish
12
Bearish
20
Neutral
0
Bullish
12
Bearish
20
Neutral
0
Bullish
12
View Standalone
View Standalone
View Standalone
View Standalone
View Standalone
View Standalone
View Standalone
View Standalone







CMS Info Systems is a leading Indian business services company providing ATM and cash logistics, retail cash services, ATM hardware/software, and payments and surveillance technology to banks, retailers and e‑commerce companies across a national network of ATMs, retail touchpoints and currency in‑transit routes.
In Q1 FY27, total revenue was INR635 crores with services revenue at an all‑time high of INR625 crores; EBITDA was INR173 crores with margins expanding to 27.2%, though PAT was INR84 crores impacted by higher depreciation and a temporary cash supply squeeze that reduced some transaction-linked revenue.
The company won INR500 crores of new orders in Q1 including a HDFC Bank contract (6,000 ATMs, TCV INR400 crores) and reports long-term mandates with SBI and ICICI, signaling sustained contract momentum and stronger revenue visibility from large integrated outsourcing deals.
Technology and Payments is a fast-growing strategic pillar, now ~18% of services revenue in Q1 and guided to exceed 20% by Q4; CMS Info Systems has commercialized HAWKAI (vision AI) and ALGO MVS (ATM software) which are already deployed at national scale and driving higher‑margin revenue.
Operational headwinds this quarter included a severe currency supply squeeze that reduced ATM fill rates to c.70% at the trough and cost pressures from state minimum wage increases and fuel inflation; management expects supply to normalize by end‑Q2 and has raised EBITDA margin guidance despite trimmed revenue guidance.
Commercial Services & Supplies
Diversified Commercial Services
3,371 Cr
Low Risk
11.2
19.8
-0.6
1.4
374.10
197.05
Sales CAGR
Profit CAGR
ROE
ROCE


CMS Info Systems Ltd (CMSINFO) is currently trading at 210.25 per share. Stock prices fluctuate during market hours on NSE and BSE based on demand, company updates, and overall market conditions. Refer to the live price chart above for the most recent price movement.
CMS Info Systems is a leading Indian business services company providing ATM and cash logistics, retail cash services, ATM hardware/software, and payments and surveillance technology to banks, retailers and e‑commerce companies across a national network of ATMs, retail touchpoints and currency in‑transit routes. In Q1 FY27, total revenue was INR635 crores with services revenue at an all‑time high of INR625 crores; EBITDA was INR173 crores with margins expanding to 27.2%, though PAT was INR84 crores impacted by higher depreciation and a temporary cash supply squeeze that reduced some transaction-linked revenue. The company won INR500 crores of new orders in Q1 including a HDFC Bank contract (6,000 ATMs, TCV INR400 crores) and reports long-term mandates with SBI and ICICI, signaling sustained contract momentum and stronger revenue visibility from large integrated outsourcing deals. Technology and Payments is a fast-growing strategic pillar, now ~18% of services revenue in Q1 and guided to exceed 20% by Q4; CMS Info Systems has commercialized HAWKAI (vision AI) and ALGO MVS (ATM software) which are already deployed at national scale and driving higher‑margin revenue. Operational headwinds this quarter included a severe currency supply squeeze that reduced ATM fill rates to c.70% at the trough and cost pressures from state minimum wage increases and fuel inflation; management expects supply to normalize by end‑Q2 and has raised EBITDA margin guidance despite trimmed revenue guidance.
Over the past 52 weeks, CMS Info Systems Ltd has traded between a low of ₹197.05 and a high of ₹374.10. The 52-week high and low indicate the stock’s price range over the last year and help investors understand its volatility and recent trading levels.
CMS Info Systems Ltd has a market capitalization of approximately 3,370.94. Market capitalization represents the total value of a company’s outstanding shares and helps investors understand its size, stability, and relative risk compared to other listed companies.
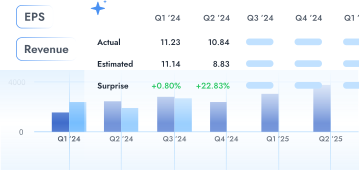
CMS Info Systems Ltd’s investment profile depends on its business fundamentals, valuation, and long-term outlook. The stock currently trades at a PE ratio of 11.23 and operates in the its sector sector. Investors typically assess financial performance, growth prospects, and individual risk tolerance before making investment decisions.
Based on its market capitalization of 3,370.94 Cr, CMS Info Systems Ltd is classified as a Small Cap stock. Large-cap stocks are generally more stable, while mid-cap and small-cap stocks tend to offer higher growth potential along with higher price volatility.
CMS Info Systems Ltd operates in the its sector sector. Sector classification matters because companies in the same sector are often affected by similar economic conditions, regulatory changes, and competitive dynamics, which can influence overall stock performance.
The Price-to-Earnings (PE) ratio of CMS Info Systems Ltd is 11.23. The PE ratio compares a company’s share price to its earnings and is commonly used to assess valuation. Comparing the PE ratio with sector peers and historical levels provides better context.
The call notes stated revenue grew 3% year-on-year to ₹2,487 crore, with service revenue (annuity) up 6% to ₹2,312 crore.
The stock fell after multiple block deals led to over 27% of the company’s equity changing hands, with reports linking the trades to a promoter stake sale.
Standalone net sales were ₹572.78 crore (up 0.18% YoY) and consolidated net sales were ₹632.93 crore (up 2.24% YoY).
For Q3 FY26, the company reported consolidated revenue of ₹618 crore (2% QoQ) and Business EBITDA of ₹158 crore (9% QoQ). PBT before exceptional items was stated at ₹88 crore (-8% QoQ).
| Symbol | Watchlist | Price | Market Cap | P/E | P/B | Div Yield (%) | ROE (%) | ROCE (%) | ROA (%) |
306.05 | 4,572 Cr | 16.55 | 3.92 | 3.59 | 23.29 | 24.81 | 7.57 | ||
169.50 | 3,593 Cr | -38.44 | 6.98 | 0.00 | -20.66 | 5.20 | -1.44 | ||
204.75 | 3,277 Cr | 11.17 | 1.35 | 2.64 | 12.47 | 15.97 | 9.06 | ||
366.25 | 3,171 Cr | 15.91 | 2.42 | 0.55 | 14.06 | 14.59 | 8.50 | ||
103.90 | 2,961 Cr | -251.37 | 6.83 | 0.00 | -2.59 | -1.07 | -1.01 | ||
171.35 | 2,569 Cr | 9.93 | 2.52 | 0.00 | 28.68 | 15.92 | 9.68 | ||
148.40 | 2,219 Cr | -127.07 | 3.32 | 0.00 | 1.03 | 5.72 | -1.03 | ||
| Median: 7 Co. | — | 171.35 | 3,171 Cr | 9.93 | 3.32 | 0.00 | 12.47 | 14.59 | 7.57 |