Actions
Action Type





IRIS
Multibagg AI is an AI powered stock research and analysis platform. We provide data, information, content, and analytics for publicly traded Indian companies listed on NSE and BSE. AI can make mistakes, check important information.
Prices might be delayed by a few minutes.
Join our Exclusive Community


Join our Exclusive Community
Made with 💙 in India. © Finsky Technologies Pvt Ltd. 2026


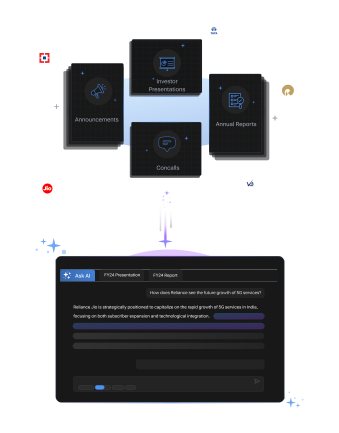
Get instant AI-powered insights about company performance, financials, and strategy. Ask questions about trends, competition, and developments while receiving responses backed by official documents and market data, with clear attribution to source documents.




 Discovery themes featuring this stock
Bearish
7
Neutral
3
Bullish
4
Bearish
7
Neutral
3
Bullish
36
Bearish
0
Neutral
0
Bullish
32
Bearish
0
Neutral
0
Bullish
32
Bearish
0
Neutral
0
Bullish
32
Bearish
0
Neutral
0
Bullish
32
Upcoming Result Date: Nov 12, 2026
 Discovery themes featuring this stock



Manomay Tex India Limited manufactures and sells synthetic denim fabrics from integrated facilities in Rajasthan and Ichalkaranji, operating from yarn processing through weaving and finishing, and has positioned itself under the brand name 'Manomay' while serving domestic and international customers with an installed capacity of roughly 17 million metres per annum.
For the quarter ended 30 June 2026 the company reported total revenue of Rs. 19,761.32 lakhs and profit before tax of Rs. 663.39 lakhs, with net profit of Rs. 495.18 lakhs; year‑on‑year total revenue rose about 20% versus the prior June quarter, while net margins remain modest near mid‑single digits reflecting cost and working capital dynamics.
Manomay has pursued meaningful vertical integration and capacity upgrades: Tsudakoma air‑jet looms added in 2021‑22 increased production by ~33%, a new spinning unit came online in 2024, and the company launched its own apparel brand and e‑commerce channel in 2025 to capture higher value‑added margins and upstream‑to‑downstream synergies.
Financial discipline indicators include a limited review by statutory auditors with no adverse findings and a reported decline in finance cost quarter‑on‑quarter; however, textile commodity volatility, working capital intensity, and comparatively low operating margins remain material considerations for stakeholders.
The strategic move into branded apparel creates a clear revenue‑mix opportunity but requires execution on distribution, inventory management, and brand marketing to translate manufacturing scale into sustainable margin expansion across domestic and export markets.
Textiles & Apparels
Other Textile Products
474 Cr
Low Risk
23.5
25.8
1.6
2.8
279.60
164.70
Sales CAGR
Profit CAGR
ROE
ROCE
Manomay Tex India Ltd (MANOMAY) is currently trading at 262.90 per share. Stock prices fluctuate during market hours on NSE and BSE based on demand, company updates, and overall market conditions. Refer to the live price chart above for the most recent price movement.
Manomay Tex India Limited manufactures and sells synthetic denim fabrics from integrated facilities in Rajasthan and Ichalkaranji, operating from yarn processing through weaving and finishing, and has positioned itself under the brand name 'Manomay' while serving domestic and international customers with an installed capacity of roughly 17 million metres per annum. For the quarter ended 30 June 2026 the company reported total revenue of Rs. 19,761.32 lakhs and profit before tax of Rs. 663.39 lakhs, with net profit of Rs. 495.18 lakhs; year‑on‑year total revenue rose about 20% versus the prior June quarter, while net margins remain modest near mid‑single digits reflecting cost and working capital dynamics. Manomay has pursued meaningful vertical integration and capacity upgrades: Tsudakoma air‑jet looms added in 2021‑22 increased production by ~33%, a new spinning unit came online in 2024, and the company launched its own apparel brand and e‑commerce channel in 2025 to capture higher value‑added margins and upstream‑to‑downstream synergies. Financial discipline indicators include a limited review by statutory auditors with no adverse findings and a reported decline in finance cost quarter‑on‑quarter; however, textile commodity volatility, working capital intensity, and comparatively low operating margins remain material considerations for stakeholders. The strategic move into branded apparel creates a clear revenue‑mix opportunity but requires execution on distribution, inventory management, and brand marketing to translate manufacturing scale into sustainable margin expansion across domestic and export markets.
Over the past 52 weeks, Manomay Tex India Ltd has traded between a low of ₹164.70 and a high of ₹279.60. The 52-week high and low indicate the stock’s price range over the last year and help investors understand its volatility and recent trading levels.
Manomay Tex India Ltd has a market capitalization of approximately 474.23. Market capitalization represents the total value of a company’s outstanding shares and helps investors understand its size, stability, and relative risk compared to other listed companies.
Manomay Tex India Ltd’s investment profile depends on its business fundamentals, valuation, and long-term outlook. The stock currently trades at a PE ratio of 23.53 and operates in the its sector sector. Investors typically assess financial performance, growth prospects, and individual risk tolerance before making investment decisions.
Based on its market capitalization of 474.23 Cr, Manomay Tex India Ltd is classified as a Small Cap stock. Large-cap stocks are generally more stable, while mid-cap and small-cap stocks tend to offer higher growth potential along with higher price volatility.
Manomay Tex India Ltd operates in the its sector sector. Sector classification matters because companies in the same sector are often affected by similar economic conditions, regulatory changes, and competitive dynamics, which can influence overall stock performance.
The Price-to-Earnings (PE) ratio of Manomay Tex India Ltd is 23.53. The PE ratio compares a company’s share price to its earnings and is commonly used to assess valuation. Comparing the PE ratio with sector peers and historical levels provides better context.
| Symbol | Watchlist | Price | Market Cap | P/E | P/B | Div Yield (%) | ROE (%) | ROCE (%) | ROA (%) |
122.30 | 530 Cr | 7.34 | 0.53 | 0.00 | 4.92 | 6.30 | 3.80 | ||
262.90 | 474 Cr | 23.53 | 2.77 | 0.00 | 11.49 | 10.94 | 2.98 | ||
84.00 | 444 Cr | 9.67 | 1.60 | 0.23 | 15.69 | 12.15 | 5.39 | ||
16.58 | 435 Cr | -29.38 | 1.68 | 0.00 | -5.66 | -4.53 | -4.56 | ||
41.31 | 415 Cr | 45.40 | 1.29 | 1.82 | 3.62 | 4.47 | 1.98 | ||
13.19 | 410 Cr | -45.69 | 1.11 | 0.00 | -12.54 | -3.80 | -1.35 | ||
103.95 | 405 Cr | -316.36 | 11.94 | 0.00 | -3.76 | 1.15 | -1.08 | ||
| Median: 7 Co. | — | 84.00 | 435 Cr | 7.34 | 1.60 | 0.00 | 3.62 | 4.47 | 1.98 |