







Board Meeting
Oil India Board to Consider Q2 Results
Oil India’s Board will meet on 12 November 2026 to consider unaudited standalone and consolidated results for the quarter and half-year ended 30 September 2026, and a possible interim dividend.



Welcome to Multibagg AI
Log in to access personalized features
IRIS
Multibagg AI is an AI powered stock research and analysis platform. We provide data, information, content, and analytics for publicly traded Indian companies listed on NSE and BSE. AI can make mistakes, check important information.
Research powered by GOALZEN CAPITAL SERVICES PRIVATE LIMITED · SEBI Research Analyst INH000013448
Prices might be delayed by a few minutes.
Join our Exclusive Community


Join our Exclusive Community
Made with 💙 in India. © Finsky Technologies Pvt Ltd. 2026


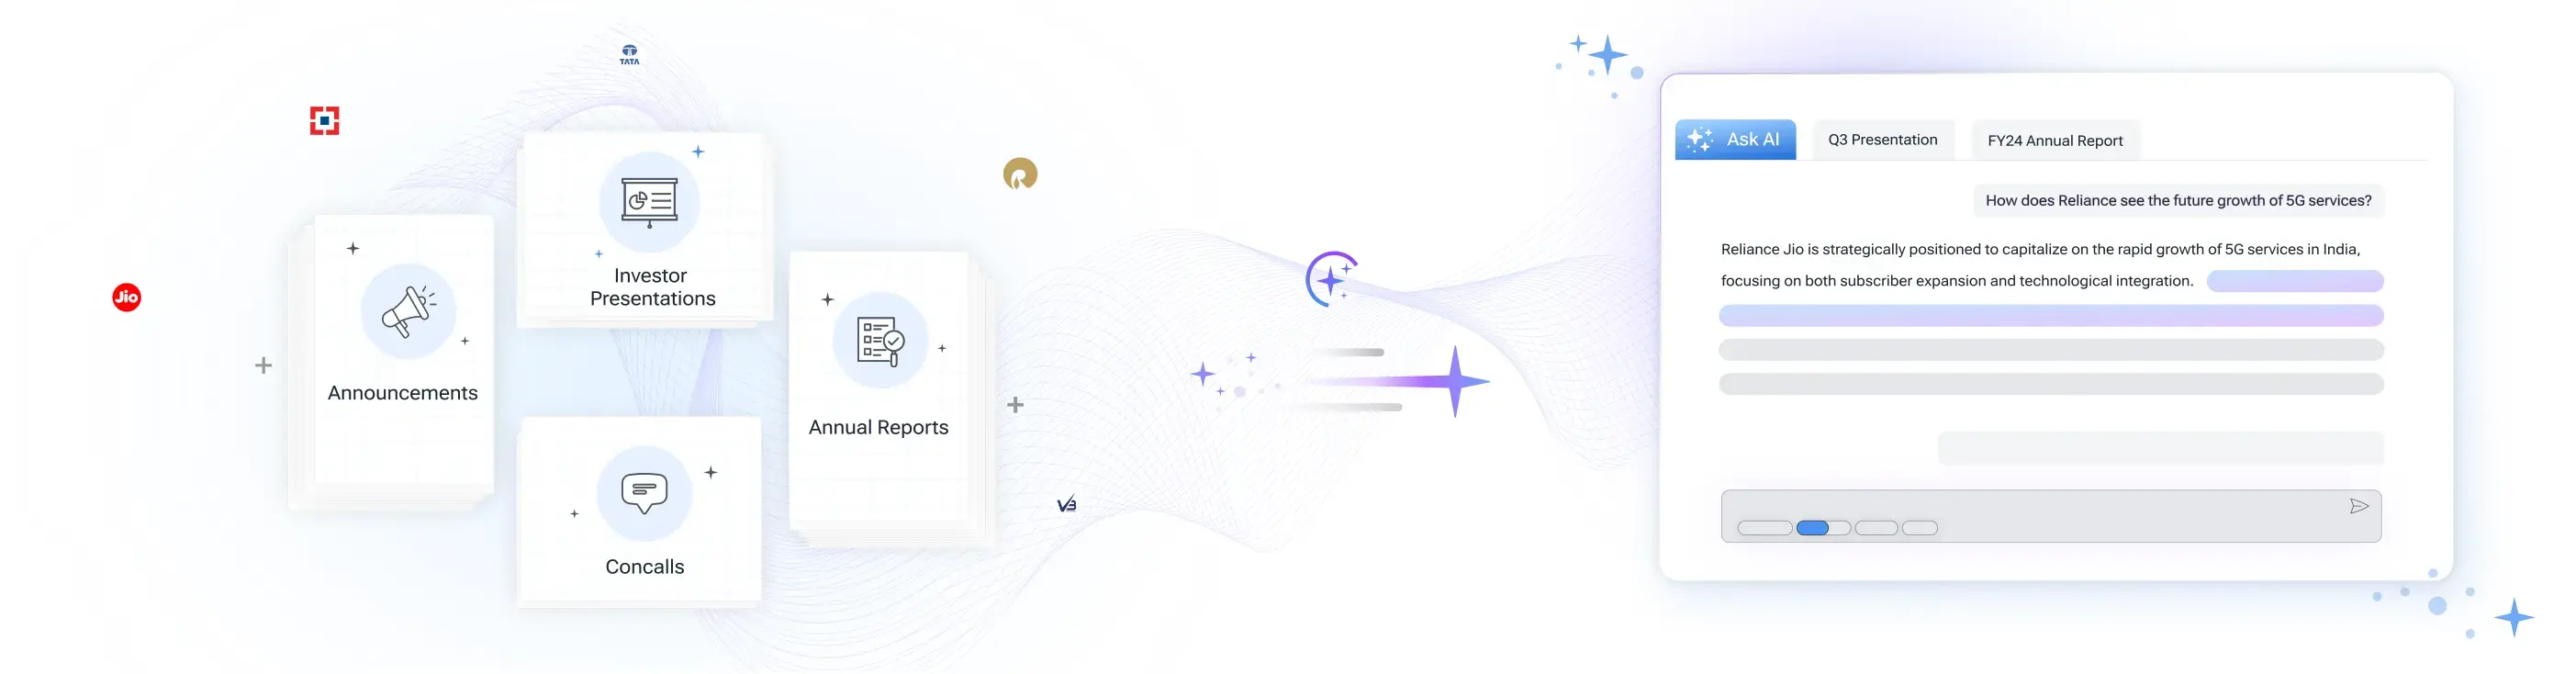
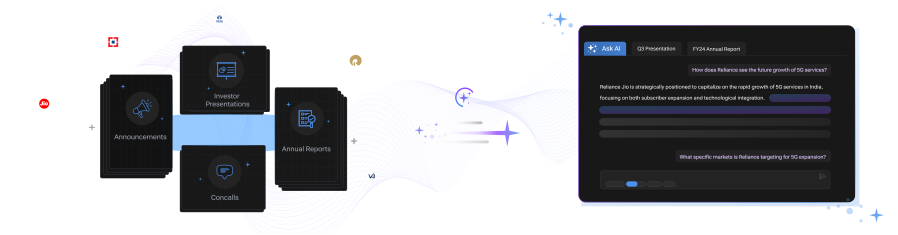
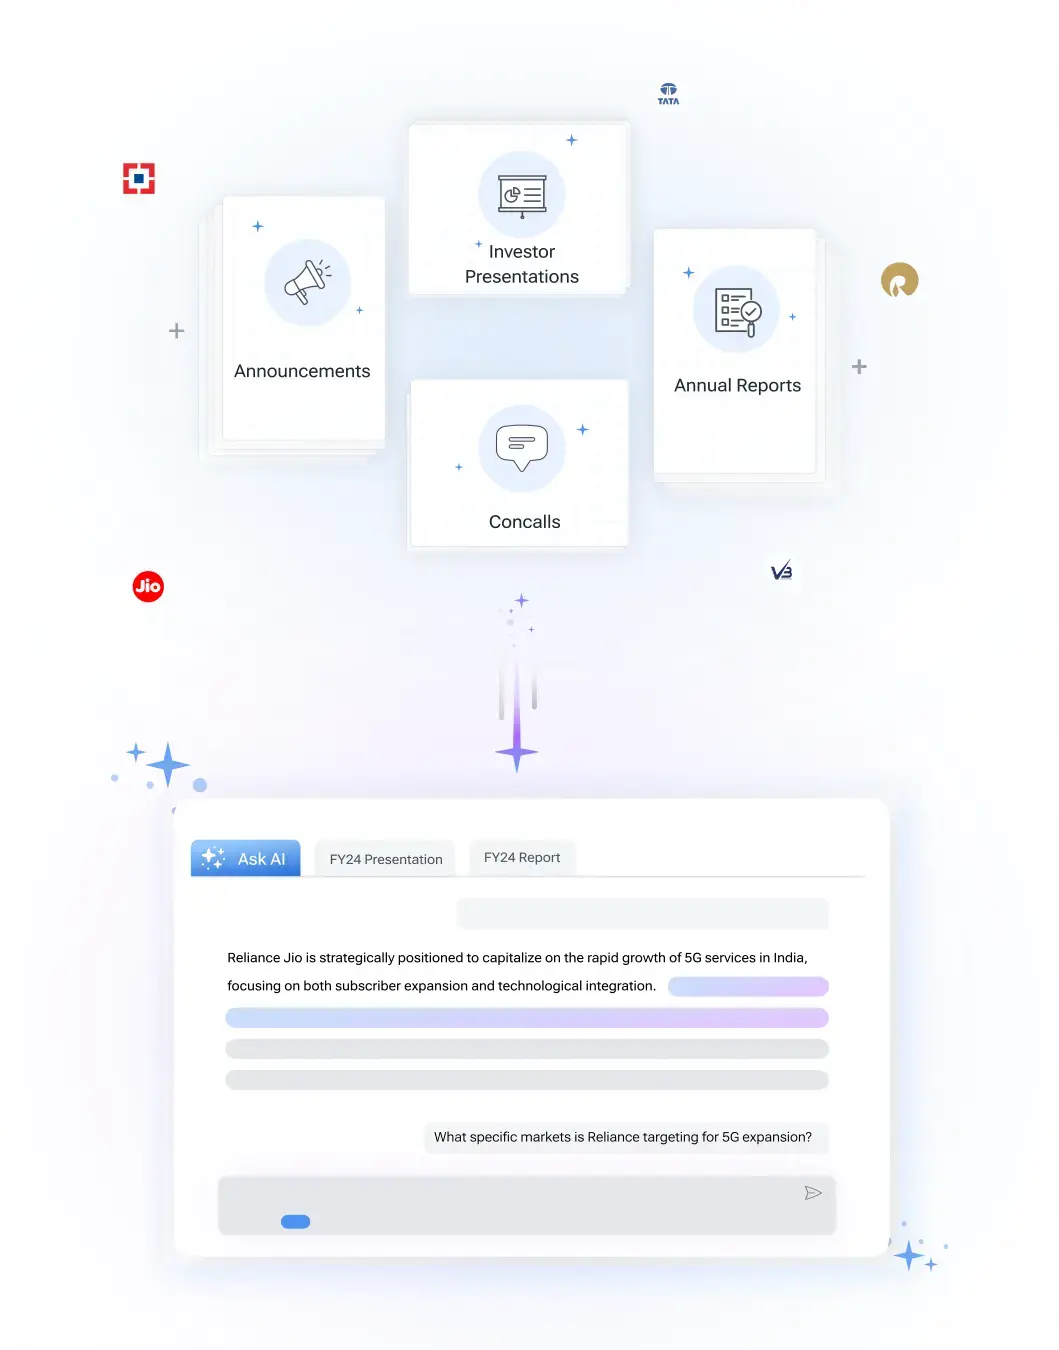
Get instant AI-powered insights about company performance, financials, and strategy. Ask questions about trends, competition, and developments while receiving responses backed by official documents and market data, with clear attribution to source documents.

 Discovery themes featuring this stock
Bearish
1
Neutral
8
Bullish
5
Bearish
17
Neutral
8
Bullish
21
Bearish
16
Neutral
0
Bullish
16
Bearish
16
Neutral
0
Bullish
16
Bearish
16
Neutral
0
Bullish
16
Bearish
16
Neutral
0
Bullish
16



Oil India Limited is a Maharatna upstream E&P company focused on exploration, development and production of crude oil, natural gas, LPG and condensates, while also operating pipeline transportation and renewable energy assets; the Government of India remains the majority promoter with a diversified domestic and select international footprint.
Q1 FY27 delivered record financials: standalone operating revenue of INR7,958 crore and EBITDA of ~INR4,605 crore (54% margin), standalone PAT INR2,870 crore and consolidated PAT INR4,026 crore, marking the highest quarterly profitability since listing and reflecting strong crude realizations and refining gains via its NRL subsidiary.
Operationally the company reported 0.95 MMT crude oil in the quarter with a single-day peak of 10,921 MT and said it expects to sustain ~1 MMT per quarter; upstream activity accelerated with 17 wells in Q1 and a FY27 drilling target of 100 wells, indicating a significant push on near‑term production growth.
Gas monetization remains constrained by evacuation infrastructure, but management outlined multiple fixes: DNPL designated as common carrier, a short 200m connectivity at NRL, feeder line construction (~20% complete) and IGGL tie‑ins; once pipelines commission (targets through Dec 2027–Mar 2028), management expects a step‑up toward the 3.8–5 BCM range over the medium term.
Numaligarh Refinery Limited is a material earnings driver: Q1 NRL achieved ~105% capacity utilization, distillate yield of 87%, GRM ~USD35.95/b (inventory gains ~USD2), and reported robust EBITDA and PAT; NRL expansion capex (~INR34–35k crore) and associated project debt (~INR19k crore) are central to consolidated cashflows and leverage.
Oil
Oil Exploration & Production
73,767 Cr
Low Risk
7.7
7.6
0.9
1.3
531.00
395.75
Sales CAGR
Profit CAGR
ROE
ROCE


Upcoming Result Date: Nov 11, 2026
View Standalone
View Standalone
View Standalone
View Standalone
View Standalone
View Standalone
View Standalone
View Standalone
Discovery themes featuring this stock


Oil India Ltd (OIL) is currently trading at 453.50 per share. Stock prices fluctuate during market hours on NSE and BSE based on demand, company updates, and overall market conditions. Refer to the live price chart above for the most recent price movement.
Oil India Limited is a Maharatna upstream E&P company focused on exploration, development and production of crude oil, natural gas, LPG and condensates, while also operating pipeline transportation and renewable energy assets; the Government of India remains the majority promoter with a diversified domestic and select international footprint. Q1 FY27 delivered record financials: standalone operating revenue of INR7,958 crore and EBITDA of ~INR4,605 crore (54% margin), standalone PAT INR2,870 crore and consolidated PAT INR4,026 crore, marking the highest quarterly profitability since listing and reflecting strong crude realizations and refining gains via its NRL subsidiary. Operationally the company reported 0.95 MMT crude oil in the quarter with a single-day peak of 10,921 MT and said it expects to sustain ~1 MMT per quarter; upstream activity accelerated with 17 wells in Q1 and a FY27 drilling target of 100 wells, indicating a significant push on near‑term production growth. Gas monetization remains constrained by evacuation infrastructure, but management outlined multiple fixes: DNPL designated as common carrier, a short 200m connectivity at NRL, feeder line construction (~20% complete) and IGGL tie‑ins; once pipelines commission (targets through Dec 2027–Mar 2028), management expects a step‑up toward the 3.8–5 BCM range over the medium term. Numaligarh Refinery Limited is a material earnings driver: Q1 NRL achieved ~105% capacity utilization, distillate yield of 87%, GRM ~USD35.95/b (inventory gains ~USD2), and reported robust EBITDA and PAT; NRL expansion capex (~INR34–35k crore) and associated project debt (~INR19k crore) are central to consolidated cashflows and leverage.
Over the past 52 weeks, Oil India Ltd has traded between a low of ₹395.75 and a high of ₹531.00. The 52-week high and low indicate the stock’s price range over the last year and help investors understand its volatility and recent trading levels.
Oil India Ltd has a market capitalization of approximately 73,766.66. Market capitalization represents the total value of a company’s outstanding shares and helps investors understand its size, stability, and relative risk compared to other listed companies.
Oil India Ltd’s investment profile depends on its business fundamentals, valuation, and long-term outlook. The stock currently trades at a PE ratio of 7.74 and operates in the its sector sector. Investors typically assess financial performance, growth prospects, and individual risk tolerance before making investment decisions.
Based on its market capitalization of 73,766.66 Cr, Oil India Ltd is classified as a Mid Cap stock. Large-cap stocks are generally more stable, while mid-cap and small-cap stocks tend to offer higher growth potential along with higher price volatility.
Oil India Ltd operates in the its sector sector. Sector classification matters because companies in the same sector are often affected by similar economic conditions, regulatory changes, and competitive dynamics, which can influence overall stock performance.
The Price-to-Earnings (PE) ratio of Oil India Ltd is 7.74. The PE ratio compares a company’s share price to its earnings and is commonly used to assess valuation. Comparing the PE ratio with sector peers and historical levels provides better context.
Oil India fixed Friday, September 4, 2026 as the record date for its final dividend for FY 2025-26.
Oil India has fixed September 4, 2026 as the record date to determine eligible shareholders for the FY 2025-26 final dividend.
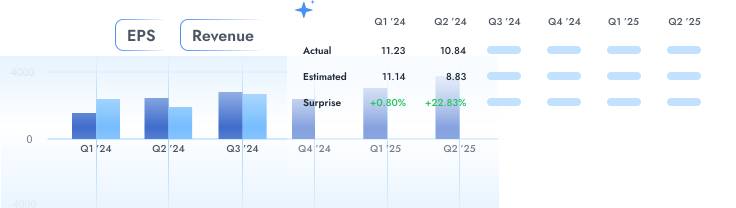
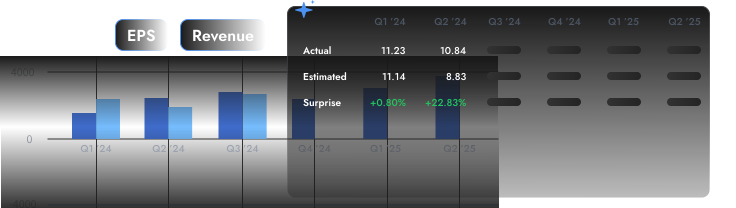
Oil India reported EPS of ₹17.65 for Q1 FY27, above the ₹12.91 forecast cited in the call material.
Oil India reported standalone profit for the period from continuing operations of ₹2,870.21 crore and EPS of ₹17.65 for the quarter ended June 30, 2026.
| Symbol | Watchlist | Price | Market Cap | P/E | P/B | Div Yield (%) | ROE (%) | ROCE (%) | ROA (%) |
226.00 | 2,84,314 Cr | 6.35 | 0.76 | 3.21 | 11.14 | 14.72 | 5.66 | ||
453.50 | 73,767 Cr | 7.74 | 1.27 | 2.54 | 11.41 | 11.08 | 7.70 | ||
30.25 | 11,829 Cr | 7.17 | 0.64 | 0.00 | 5.80 | 6.98 | 3.84 | ||
998.00 | 3,527 Cr | 19.79 | 4.59 | 0.00 | 23.21 | 30.66 | 18.21 | ||
182.15 | 2,843 Cr | 2538.50 | 6.51 | 0.00 | 0.13 | 0.10 | 0.16 | ||
153.60 | 2,031 Cr | 80.86 | 1.47 | 0.00 | 2.28 | 3.21 | 1.16 | ||
96.20 | 1,476 Cr | 76.42 | 7.21 | 0.00 | 4.75 | 6.32 | 7.91 | ||
| Median: 7 Co. | — | 182.15 | 3,527 Cr | 19.79 | 1.47 | 0.00 | 5.80 | 6.98 | 5.66 |


