





Financial Results
Vedanta Oil and Gas Publishes Q2 Results Notice
Vedanta Oil and Gas published newspaper advertisements for its unaudited financial results for the quarter and half year ended September 30, 2026.



Welcome to Multibagg AI
Log in to access personalized features
IRIS
Multibagg AI is an AI powered stock research and analysis platform. We provide data, information, content, and analytics for publicly traded Indian companies listed on NSE and BSE. AI can make mistakes, check important information.
Research powered by GOALZEN CAPITAL SERVICES PRIVATE LIMITED · SEBI Research Analyst INH000013448
Prices might be delayed by a few minutes.
Join our Exclusive Community


Join our Exclusive Community
Made with 💙 in India. © Finsky Technologies Pvt Ltd. 2026


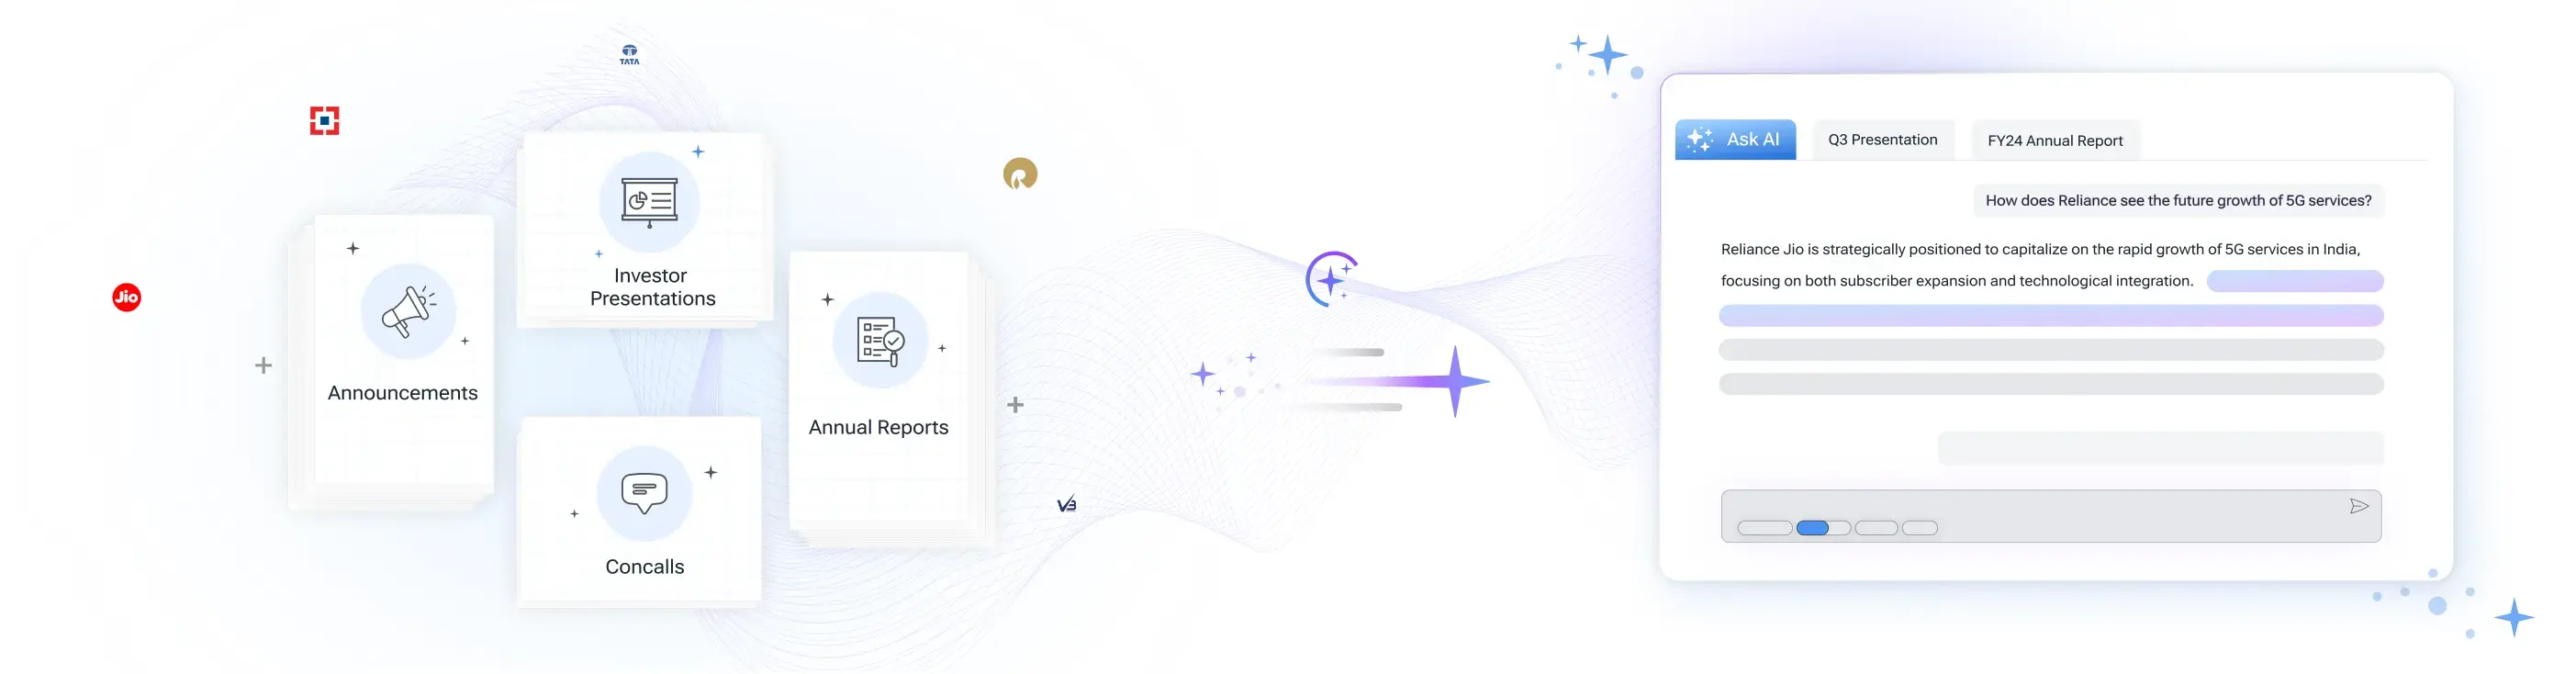
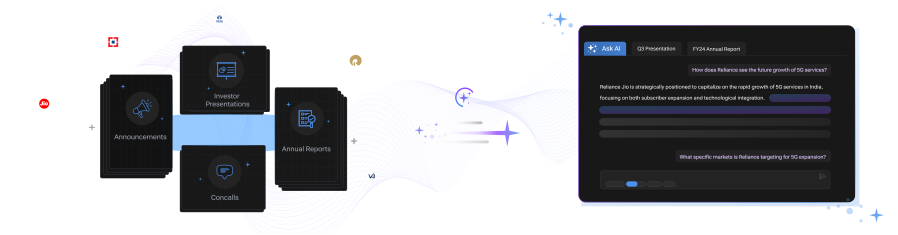
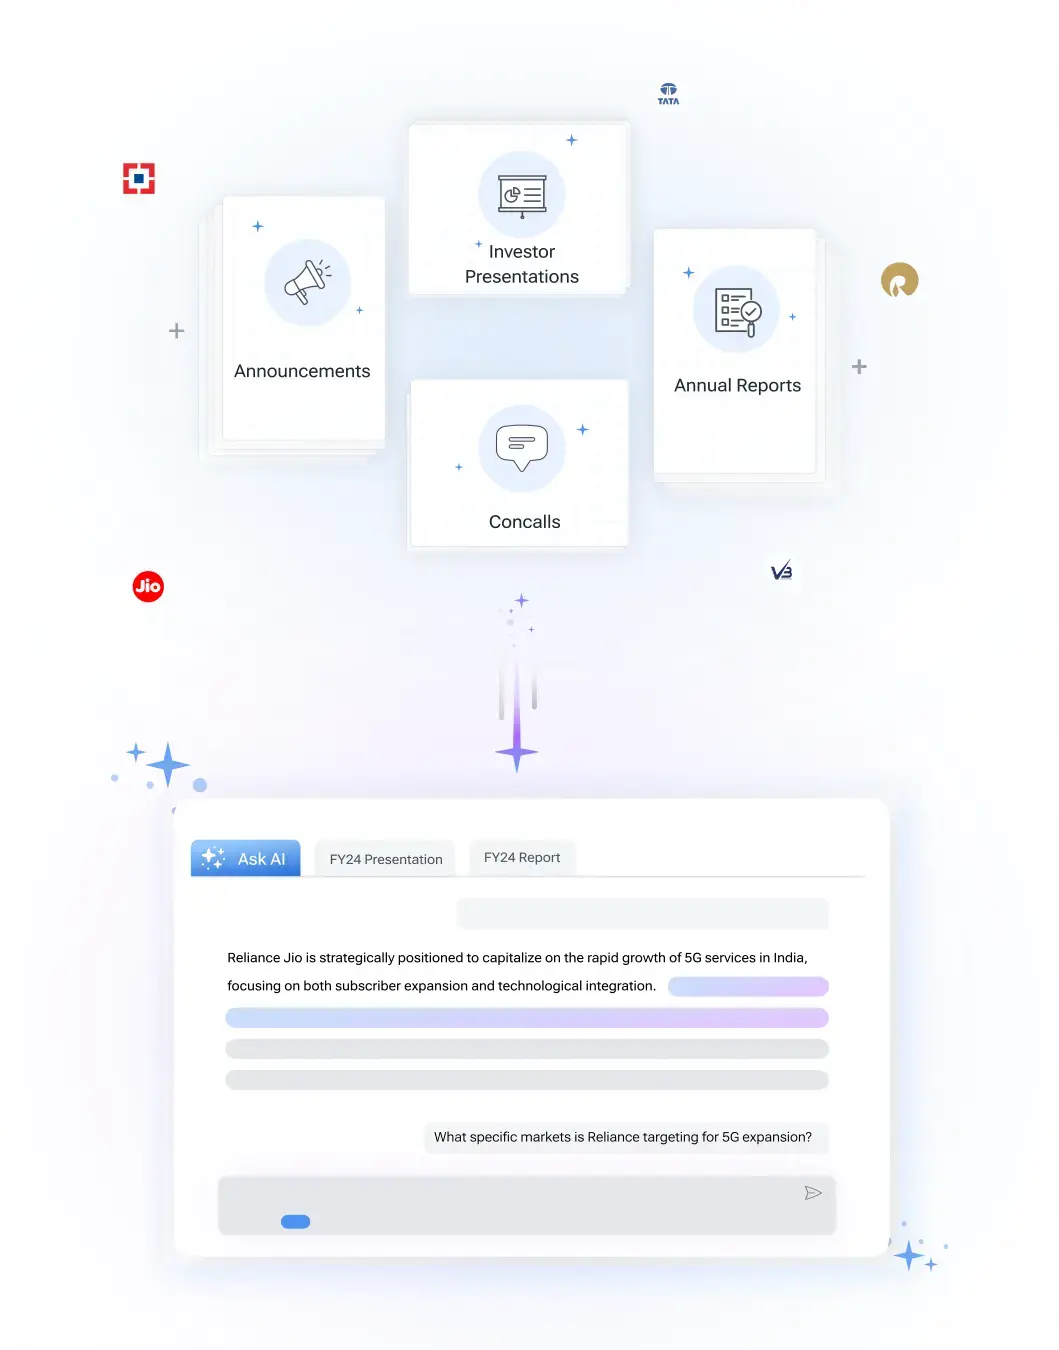
Get instant AI-powered insights about company performance, financials, and strategy. Ask questions about trends, competition, and developments while receiving responses backed by official documents and market data, with clear attribution to source documents.

 Discovery themes featuring this stock
Bearish
1
Neutral
7
Bullish
6
Bearish
6
Neutral
19
Bullish
21
Bearish
5
Neutral
12
Bullish
15
Bearish
5
Neutral
12
Bullish
15
Bearish
5
Neutral
12
Bullish
15
Bearish
5
Neutral
12
Bullish
15



Investor Presentation
Q2 FY27
View Standalone
View Standalone



Vedanta Oil and Gas Limited explores, develops and produces crude oil, condensate and natural gas across Indian hydrocarbon basins under the Cairn brand, operating 45 blocks covering approximately 47,000 square kilometres and serving large domestic refiners, gas consumers and aggregators.
Q2FY27 profitability improved sharply despite lower production: revenue rose 7% year-on-year to ₹2,486 crore, while EBITDA increased 34% to ₹1,393 crore. The 56% EBITDA margin reflects stronger price realisations and cost discipline, with oil realisation rising 41% year-on-year to $93 per barrel.
Production remains the central challenge. Gross operated output declined 19% year-on-year to 72.2 kboepd, primarily because Rajasthan production fell 15% and Cambay volumes collapsed after ONGC assumed operations. Ravva nevertheless demonstrated a positive reversal trend following low-pressure operating changes.
The company has substantial future optionality, with 137 MMBOE of 2P reserves, 1,155 MMBOE of 2C resources and exploration potential across Rajasthan, the Northeast, shallow-water assets and KG deepwater. Three Rajasthan discoveries were notified during the first half, but commercial viability remains under evaluation.
Financial flexibility is a notable strength: H1FY27 operating cash flow was ₹2,230 crore against ₹1,220 crore of capex, liquid investments were ₹2,639 crore and net debt was near zero. Management intends to recycle producing-asset cash flows into decline management, enhanced recovery and new exploration.
Oil
Oil Exploration & Production
11,829 Cr
Moderate Risk
7.2
7.6
—
0.6
47.67
26.45
Sales CAGR
Profit CAGR
ROE
ROCE
Discovery themes featuring this stock


| Symbol | Watchlist | Price | Market Cap | P/E | P/B | Div Yield (%) | ROE (%) | ROCE (%) | ROA (%) |
226.00 | 2,84,314 Cr | 6.35 | 0.76 | 3.21 | 11.14 | 14.72 | 5.66 | ||
453.50 | 73,767 Cr | 7.74 | 1.27 | 2.54 | 11.41 | 11.08 | 7.70 | ||
30.25 | 11,829 Cr | 7.17 | 0.64 | 0.00 | 5.80 | 6.98 | 3.84 | ||
998.00 | 3,527 Cr | 19.79 | 4.59 | 0.00 | 23.21 | 30.66 | 18.21 | ||
182.15 | 2,843 Cr | 2538.50 | 6.51 | 0.00 | 0.13 | 0.10 | 0.16 | ||
153.60 | 2,031 Cr | 80.86 | 1.47 | 0.00 | 2.28 | 3.21 | 1.16 | ||
96.20 | 1,476 Cr | 76.42 | 7.21 | 0.00 | 4.75 | 6.32 | 7.91 | ||
| Median: 7 Co. | — | 182.15 | 3,527 Cr | 19.79 | 1.47 | 0.00 | 5.80 | 6.98 | 5.66 |
Vedanta Oil and Gas Ltd (VOGL) is currently trading at 30.25 per share. Stock prices fluctuate during market hours on NSE and BSE based on demand, company updates, and overall market conditions. Refer to the live price chart above for the most recent price movement.
Vedanta Oil and Gas Limited explores, develops and produces crude oil, condensate and natural gas across Indian hydrocarbon basins under the Cairn brand, operating 45 blocks covering approximately 47,000 square kilometres and serving large domestic refiners, gas consumers and aggregators. Q2FY27 profitability improved sharply despite lower production: revenue rose 7% year-on-year to ₹2,486 crore, while EBITDA increased 34% to ₹1,393 crore. The 56% EBITDA margin reflects stronger price realisations and cost discipline, with oil realisation rising 41% year-on-year to $93 per barrel. Production remains the central challenge. Gross operated output declined 19% year-on-year to 72.2 kboepd, primarily because Rajasthan production fell 15% and Cambay volumes collapsed after ONGC assumed operations. Ravva nevertheless demonstrated a positive reversal trend following low-pressure operating changes. The company has substantial future optionality, with 137 MMBOE of 2P reserves, 1,155 MMBOE of 2C resources and exploration potential across Rajasthan, the Northeast, shallow-water assets and KG deepwater. Three Rajasthan discoveries were notified during the first half, but commercial viability remains under evaluation. Financial flexibility is a notable strength: H1FY27 operating cash flow was ₹2,230 crore against ₹1,220 crore of capex, liquid investments were ₹2,639 crore and net debt was near zero. Management intends to recycle producing-asset cash flows into decline management, enhanced recovery and new exploration.
Over the past 52 weeks, Vedanta Oil and Gas Ltd has traded between a low of ₹26.45 and a high of ₹47.67. The 52-week high and low indicate the stock’s price range over the last year and help investors understand its volatility and recent trading levels.
Vedanta Oil and Gas Ltd has a market capitalization of approximately 11,828.92. Market capitalization represents the total value of a company’s outstanding shares and helps investors understand its size, stability, and relative risk compared to other listed companies.
Vedanta Oil and Gas Ltd’s investment profile depends on its business fundamentals, valuation, and long-term outlook. The stock currently trades at a PE ratio of 7.17 and operates in the its sector sector. Investors typically assess financial performance, growth prospects, and individual risk tolerance before making investment decisions.
Based on its market capitalization of 11,828.92 Cr, Vedanta Oil and Gas Ltd is classified as a Small Cap stock. Large-cap stocks are generally more stable, while mid-cap and small-cap stocks tend to offer higher growth potential along with higher price volatility.
Vedanta Oil and Gas Ltd operates in the its sector sector. Sector classification matters because companies in the same sector are often affected by similar economic conditions, regulatory changes, and competitive dynamics, which can influence overall stock performance.
The Price-to-Earnings (PE) ratio of Vedanta Oil and Gas Ltd is 7.17. The PE ratio compares a company’s share price to its earnings and is commonly used to assess valuation. Comparing the PE ratio with sector peers and historical levels provides better context.
Vedanta Oil & Gas reported a consolidated net profit of ₹746 crore for the quarter ended September 2026.
Vedanta Oil & Gas reported FY26 revenue of ₹51,524 crore, up 29% year-on-year.
It disclosed an encumbrance over 2,204,724,753 shares of Vedanta Oil & Gas, equal to 56.38% of the company’s total diluted voting capital, held by promoter-group entities.
Vedanta Oil & Gas reported a consolidated net profit of Rs 945 crore for Q1 FY27 (quarter ended June 30, 2026).
Financial Results
Vedanta Oil and Gas published newspaper advertisements for its unaudited financial results for the quarter and half year ended September 30, 2026.
Earnings Call/Transcript
Vedanta Oil and Gas announced that the audio recording of its earnings conference call on Q2 and H1 FY27 unaudited results is available on its website.
Investor Presentation
Vedanta Oil and Gas released its Q2FY27 investor presentation and press release, reporting 34% YoY EBITDA growth to ₹1,393 crore and 7% YoY revenue growth to ₹2,486 crore.
Change in Directors/KMP
Vedanta Oil and Gas accepted Shivangi Dhanuka’s resignation and appointed Rupesh Kumar as Company Secretary and Compliance Officer effective November 1, 2026.
Financial Results
Vedanta Oil and Gas approved unaudited consolidated and standalone results for Q2 and H1 FY27. Auditors issued an unmodified limited review report, with a ₹379 crore impairment provision for Cambay Block assets.
Regulatory/Compliance Filing
Vedanta Oil and Gas announced that all 10 postal ballot resolutions, including ESOP, employee share purchase plans and related-party transactions, were approved by shareholders.