
Actions
Action Type





IRIS
Multibagg AI is an AI powered stock research and analysis platform. We provide data, information, content, and analytics for publicly traded Indian companies listed on NSE and BSE. AI can make mistakes, check important information.
Prices might be delayed by a few minutes.
Join our Exclusive Community


Join our Exclusive Community
Made with 💙 in India. © Finsky Technologies Pvt Ltd. 2026


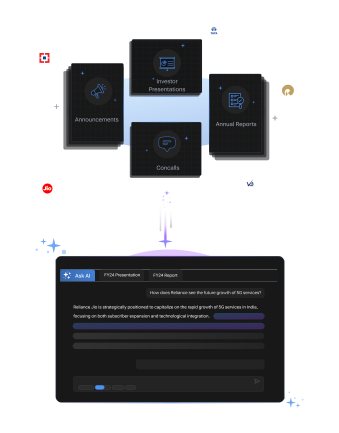
Get instant AI-powered insights about company performance, financials, and strategy. Ask questions about trends, competition, and developments while receiving responses backed by official documents and market data, with clear attribution to source documents.




 Discovery themes featuring this stock
Bearish
7
Neutral
4
Bullish
3
Bearish
7
Neutral
4
Bullish
35
Bearish
0
Neutral
0
Bullish
32
Bearish
0
Neutral
0
Bullish
32
Bearish
0
Neutral
0
Bullish
32
Bearish
0
Neutral
0
Bullish
32
View Standalone
View Standalone
View Standalone
View Standalone
View Standalone
View Standalone
View Standalone
View Standalone




Investor Presentation
Q1 FY27
Investor Presentation
Q2 FY26
Investor Presentation
Q2 FY26
Investor Presentation
Q1 FY26
Padmanabh Industries Ltd (PADMAIND) is currently trading at 8.94 per share. Stock prices fluctuate during market hours on NSE and BSE based on demand, company updates, and overall market conditions. Refer to the live price chart above for the most recent price movement.
Padmanabh Industries Limited is a Gujarat-headquartered publicly listed company primarily engaged in trading agricultural goods and commodity and agri materials; historically it traded dyes and chemical intermediates after incorporation in 1994. The company operates as a regional trader and distributor and identifies potential expansion into production or broader agri-commodity activities as a strategic objective. The board meeting dated July 22, 2026 approved unaudited standalone financial results for the quarter ended June 30, 2026, and S K Bhavsar & Co. completed a limited review that reported no matters requiring qualification. The regulatory filing confirms compliance processes and board oversight but the published financial table in the presentation is partially unclear in the provided document. Company disclosures and the company description note limited operational progress in 2022, while directors explicitly expect revenue growth driven by future expansion plans, projects, and emerging opportunities. Management emphasises a potential strategic pivot back toward manufacturing or higher-value activities in dyes/chemicals alongside ongoing agricultural trading, although specifics on timing or scale are not provided in the materials. Investment considerations include the company’s small regional scale, absence of reportable segments under Ind AS, and limited transparency on order book or contract wins. Opportunity exists if the stated expansion into manufacturing or broader agri-commodities is executed, but execution risk, commodity price volatility, and competitive pressure from established regional traders and commodity houses remain meaningful headwinds.
Over the past 52 weeks, Padmanabh Industries Ltd has traded between a low of ₹5.76 and a high of ₹10.98. The 52-week high and low indicate the stock’s price range over the last year and help investors understand its volatility and recent trading levels.
Padmanabh Industries Ltd has a market capitalization of approximately 5.43. Market capitalization represents the total value of a company’s outstanding shares and helps investors understand its size, stability, and relative risk compared to other listed companies.
Padmanabh Industries Ltd’s investment profile depends on its business fundamentals, valuation, and long-term outlook. The stock currently trades at a PE ratio of -3.31 and operates in the its sector sector. Investors typically assess financial performance, growth prospects, and individual risk tolerance before making investment decisions.
Based on its market capitalization of 5.43 Cr, Padmanabh Industries Ltd is classified as a Small Cap stock. Large-cap stocks are generally more stable, while mid-cap and small-cap stocks tend to offer higher growth potential along with higher price volatility.
Padmanabh Industries Ltd operates in the its sector sector. Sector classification matters because companies in the same sector are often affected by similar economic conditions, regulatory changes, and competitive dynamics, which can influence overall stock performance.
The Price-to-Earnings (PE) ratio of Padmanabh Industries Ltd is -3.31. The PE ratio compares a company’s share price to its earnings and is commonly used to assess valuation. Comparing the PE ratio with sector peers and historical levels provides better context.


Padmanabh Industries Limited is a Gujarat-headquartered publicly listed company primarily engaged in trading agricultural goods and commodity and agri materials; historically it traded dyes and chemical intermediates after incorporation in 1994. The company operates as a regional trader and distributor and identifies potential expansion into production or broader agri-commodity activities as a strategic objective.
The board meeting dated July 22, 2026 approved unaudited standalone financial results for the quarter ended June 30, 2026, and S K Bhavsar & Co. completed a limited review that reported no matters requiring qualification. The regulatory filing confirms compliance processes and board oversight but the published financial table in the presentation is partially unclear in the provided document.
Company disclosures and the company description note limited operational progress in 2022, while directors explicitly expect revenue growth driven by future expansion plans, projects, and emerging opportunities. Management emphasises a potential strategic pivot back toward manufacturing or higher-value activities in dyes/chemicals alongside ongoing agricultural trading, although specifics on timing or scale are not provided in the materials.
Investment considerations include the company’s small regional scale, absence of reportable segments under Ind AS, and limited transparency on order book or contract wins. Opportunity exists if the stated expansion into manufacturing or broader agri-commodities is executed, but execution risk, commodity price volatility, and competitive pressure from established regional traders and commodity houses remain meaningful headwinds.
Chemicals & Petrochemicals
Commodity Chemicals
5 Cr
Low Risk
-3.3
34.6
-0.0
24.9
10.98
5.76
Sales CAGR
Profit CAGR
ROE
ROCE


| Symbol | Watchlist | Price | Market Cap | P/E | P/B | Div Yield (%) | ROE (%) | ROCE (%) | ROA (%) |
14.10 | 9 Cr | -458.50 | 5.10 | 0.00 | -9.59 | -2.15 | -0.15 | ||
37.16 | 9 Cr | 2.99 | 1.22 | 0.00 | 45.06 | 40.03 | 28.49 | ||
9.85 | 9 Cr | 2.47 | 0.44 | 0.00 | 10.10 | 8.40 | 4.90 | ||
3.70 | 9 Cr | -1.72 | 0.00 | 0.00 | 3.71 | -72.69 | -7.06 | ||
19.65 | 8 Cr | 206.25 | 0.59 | 0.00 | -1.63 | -0.52 | 0.23 | ||
6.21 | 6 Cr | 68.22 | 0.17 | 0.00 | 0.33 | 0.45 | 0.25 | ||
8.94 | 5 Cr | -3.31 | 24.87 | 0.00 | 220.05 | 37.53 | 12.18 | ||
| Median: 7 Co. | — | 9.85 | 9 Cr | 2.47 | 0.59 | 0.00 | 3.71 | 0.45 | 0.25 |


