
Financial Results
Reganto Enterprises Publishes H1 FY27 Results
Reganto Enterprises submitted newspaper clippings of its unaudited financial results for the quarter and half year ended September 30, 2026, published on November 15, 2026.





IRIS
Multibagg AI is an AI powered stock research and analysis platform. We provide data, information, content, and analytics for publicly traded Indian companies listed on NSE and BSE. AI can make mistakes, check important information.
Prices might be delayed by a few minutes.
Join our Exclusive Community


Join our Exclusive Community
Made with 💙 in India. © Finsky Technologies Pvt Ltd. 2026


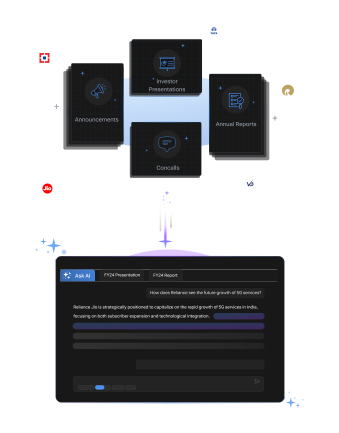
Get instant AI-powered insights about company performance, financials, and strategy. Ask questions about trends, competition, and developments while receiving responses backed by official documents and market data, with clear attribution to source documents.




 Discovery themes featuring this stock
Bearish
3
Neutral
2
Bullish
9
Bearish
34
Neutral
2
Bullish
10
Bearish
31
Neutral
0
Bullish
1
Bearish
31
Neutral
0
Bullish
1
Bearish
31
Neutral
0
Bullish
1
Bearish
31
Neutral
0
Bullish
1





Investor Presentation
Q3 FY26
Investor Presentation
Q4 FY25

Reganto Enterprises Ltd (VINTRON) is currently trading at 2.97 per share. Stock prices fluctuate during market hours on NSE and BSE based on demand, company updates, and overall market conditions. Refer to the live price chart above for the most recent price movement.
Reganto Enterprises Limited is a multi‑business Indian company engaged in construction and development of land, residential and commercial projects, infrastructure development, civil engineering works and project execution, having evolved from earlier electronics manufacturing and software services into a diversified infrastructure and integrated technologies enterprise following a 2025 name change. The half‑year financials show Total Income of 7,703.61 and reported Net Profit of 594.15 with Basic EPS of 0.37; balance sheet highlights Total Assets of 89,267.83, Total Liabilities of 79,918.78 and Net Worth of 9,349.04, while the company disclosed an audit qualification requiring investor attention. Reganto retains meaningful manufacturing capabilities and OEM services with ten high‑speed SMT machines and a declared combined capacity to produce over 500,000 CCTV cameras per month, signaling a sizable electronics hardware business alongside the newer infrastructure activities and potential diversification of revenue streams. During FY2025‑26 the company amended its main objects to add Infrastructure & Construction, Integrated Technology Solutions, Strategic Resource Solutions and Logistics & Air Cargo, indicating a strategic pivot that could materially alter future revenue composition, capex needs and execution risk compared with historical operations. Capital structure actions include issuance of 8,08,00,000 warrants on 12 December 2023 with 4,68,66,660 conversions and 1,28,53,340 warrants unexercised as of September 2025, representing a significant equity‑linked financing event that may dilute equity while providing potential funding for the company’s strategic transition.
Over the past 52 weeks, Reganto Enterprises Ltd has traded between a low of ₹2.91 and a high of ₹15.97. The 52-week high and low indicate the stock’s price range over the last year and help investors understand its volatility and recent trading levels.
Reganto Enterprises Ltd has a market capitalization of approximately 42.72. Market capitalization represents the total value of a company’s outstanding shares and helps investors understand its size, stability, and relative risk compared to other listed companies.
Reganto Enterprises Ltd’s investment profile depends on its business fundamentals, valuation, and long-term outlook. The stock currently trades at a PE ratio of 11.36 and operates in the its sector sector. Investors typically assess financial performance, growth prospects, and individual risk tolerance before making investment decisions.
Based on its market capitalization of 42.72 Cr, Reganto Enterprises Ltd is classified as a Small Cap stock. Large-cap stocks are generally more stable, while mid-cap and small-cap stocks tend to offer higher growth potential along with higher price volatility.
Reganto Enterprises Ltd operates in the its sector sector. Sector classification matters because companies in the same sector are often affected by similar economic conditions, regulatory changes, and competitive dynamics, which can influence overall stock performance.
The Price-to-Earnings (PE) ratio of Reganto Enterprises Ltd is 11.36. The PE ratio compares a company’s share price to its earnings and is commonly used to assess valuation. Comparing the PE ratio with sector peers and historical levels provides better context.
Financial Results
Reganto Enterprises submitted newspaper clippings of its unaudited financial results for the quarter and half year ended September 30, 2026, published on November 15, 2026.
Financial Results
Reganto Enterprises approved unaudited standalone financial results for the quarter and half-year ended September 30, 2026, with the auditor’s limited review report.


Reganto Enterprises Limited is a multi‑business Indian company engaged in construction and development of land, residential and commercial projects, infrastructure development, civil engineering works and project execution, having evolved from earlier electronics manufacturing and software services into a diversified infrastructure and integrated technologies enterprise following a 2025 name change.
The half‑year financials show Total Income of 7,703.61 and reported Net Profit of 594.15 with Basic EPS of 0.37; balance sheet highlights Total Assets of 89,267.83, Total Liabilities of 79,918.78 and Net Worth of 9,349.04, while the company disclosed an audit qualification requiring investor attention.
Reganto retains meaningful manufacturing capabilities and OEM services with ten high‑speed SMT machines and a declared combined capacity to produce over 500,000 CCTV cameras per month, signaling a sizable electronics hardware business alongside the newer infrastructure activities and potential diversification of revenue streams.
During FY2025‑26 the company amended its main objects to add Infrastructure & Construction, Integrated Technology Solutions, Strategic Resource Solutions and Logistics & Air Cargo, indicating a strategic pivot that could materially alter future revenue composition, capex needs and execution risk compared with historical operations.
Capital structure actions include issuance of 8,08,00,000 warrants on 12 December 2023 with 4,68,66,660 conversions and 1,28,53,340 warrants unexercised as of September 2025, representing a significant equity‑linked financing event that may dilute equity while providing potential funding for the company’s strategic transition.
IT - Hardware
Computers Hardware & Equipments
43 Cr
Low Risk
11.6
20.7
-0.1
0.4
15.97
2.91
Sales CAGR
Profit CAGR
ROE
ROCE
| Symbol | Watchlist | Price | Market Cap | P/E | P/B | Div Yield (%) | ROE (%) | ROCE (%) | ROA (%) |
18.25 | 65 Cr | -4.80 | 1.13 | 0.00 | -24.09 | -20.27 | -17.62 | ||
113.05 | 60 Cr | 6.58 | 1.50 | 0.00 | 16.77 | 19.01 | 7.96 | ||
2.92 | 43 Cr | 11.36 | 0.44 | 0.00 | 3.91 | 6.80 | 0.37 | ||
88.53 | 43 Cr | 212.90 | 4.55 | 0.00 | 6.56 | 6.20 | 1.08 | ||
2.04 | 25 Cr | -0.32 | 0.34 | 0.00 | -89.50 | -54.84 | -48.11 | ||
2.19 | 24 Cr | -11.86 | 1.72 | 0.00 | -1.64 | -1.64 | -12.95 | ||
105.00 | 21 Cr | 14.58 | 2.80 | 3.24 | 18.19 | 21.70 | 11.27 | ||
| Median: 7 Co. | — | 18.25 | 43 Cr | 6.58 | 1.50 | 0.00 | 3.91 | 6.20 | 0.37 |


