


Regulatory/Compliance Filing
Remsons Industries Flood Update: Partial Resumption
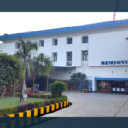
Remsons Industries informs exchanges that water has receded at its Daman facilities; power restored and gradual production resumed from 2026-07-27. Pardi (Valsad) plant water receded but power remains unavailable and operations remain suspended.