








Earnings Call/Transcript
SEAMEC Audio Recording Released
SEAMEC released the audio recording of its Q2 FY27 earnings call held on November 4, 2026, with investors and analysts.





Welcome to Multibagg AI
Log in to access personalized features
IRIS
Multibagg AI is an AI powered stock research and analysis platform. We provide data, information, content, and analytics for publicly traded Indian companies listed on NSE and BSE. AI can make mistakes, check important information.
Prices might be delayed by a few minutes.
Join our Exclusive Community


Join our Exclusive Community
Made with 💙 in India. © Finsky Technologies Pvt Ltd. 2026


Get instant AI-powered insights about company performance, financials, and strategy. Ask questions about trends, competition, and developments while receiving responses backed by official documents and market data, with clear attribution to source documents.





 Discovery themes featuring this stock
Bearish
3
Neutral
5
Bullish
6
Bearish
33
Neutral
5
Bullish
8
Bearish
30
Neutral
0
Bullish
2
Bearish
30
Neutral
0
Bullish
2
Bearish
30
Neutral
0
Bullish
2
Bearish
30
Neutral
0
Bullish
2
View Standalone
View Standalone
View Standalone
View Standalone
View Standalone
View Standalone
View Standalone
View Standalone







SEAMEC Limited provides specialized offshore engineering, diving support, subsea construction, marine support and bulk transportation services through a diversified vessel fleet. Its core offering serves offshore oil and gas operators, particularly through Diving Support Vessels, Offshore Support Vessels, accommodation assets and related subsea capabilities.
H1 FY27 consolidated revenue grew 61% to ₹495 crore, while EBITDA rose 55% to ₹162 crore and PAT increased 163% to ₹132 crore. The sharp PAT increase was aided by a ₹42.4 crore gain from selling SEAMEC Gallant, making reported earnings growth materially stronger than underlying operating growth.
SEAMEC Limited’s newest fleet addition, SEAMEC Anant, was acquired for USD 70 million and placed on a roughly USD 55 million, 1,225-day ONGC IMR charter shortly afterward. This demand-backed acquisition demonstrates a capital-allocation model focused on securing employment around major vessel investments.
The company operates in a favorable offshore-services cycle, supported by ageing infrastructure, constrained vessel supply, rising subsea IMR activity and India’s expanding offshore exploration agenda. Domestic revenue represented approximately 83% in FY26, leaving the company strongly exposed to ONGC and Indian offshore capex.
Despite strong half-year growth, quarterly profitability remains volatile: standalone Q2 EBITDA margin was 17% versus 41.2% in Q1, while PAT margin fell to 2.3%. Higher depreciation, operating costs, vessel repairs and uneven deployment can therefore materially affect reported earnings between quarters.
Transport Services
Shipping
4,064 Cr
Low Risk
12.1
19.6
0.6
3.1
1,845.00
773.50
Sales CAGR
Profit CAGR
ROE
ROCE



SEAMEC Ltd (SEAMECLTD) is currently trading at 1,547.50 per share. Stock prices fluctuate during market hours on NSE and BSE based on demand, company updates, and overall market conditions. Refer to the live price chart above for the most recent price movement.
SEAMEC Limited provides specialized offshore engineering, diving support, subsea construction, marine support and bulk transportation services through a diversified vessel fleet. Its core offering serves offshore oil and gas operators, particularly through Diving Support Vessels, Offshore Support Vessels, accommodation assets and related subsea capabilities. H1 FY27 consolidated revenue grew 61% to ₹495 crore, while EBITDA rose 55% to ₹162 crore and PAT increased 163% to ₹132 crore. The sharp PAT increase was aided by a ₹42.4 crore gain from selling SEAMEC Gallant, making reported earnings growth materially stronger than underlying operating growth. SEAMEC Limited’s newest fleet addition, SEAMEC Anant, was acquired for USD 70 million and placed on a roughly USD 55 million, 1,225-day ONGC IMR charter shortly afterward. This demand-backed acquisition demonstrates a capital-allocation model focused on securing employment around major vessel investments. The company operates in a favorable offshore-services cycle, supported by ageing infrastructure, constrained vessel supply, rising subsea IMR activity and India’s expanding offshore exploration agenda. Domestic revenue represented approximately 83% in FY26, leaving the company strongly exposed to ONGC and Indian offshore capex. Despite strong half-year growth, quarterly profitability remains volatile: standalone Q2 EBITDA margin was 17% versus 41.2% in Q1, while PAT margin fell to 2.3%. Higher depreciation, operating costs, vessel repairs and uneven deployment can therefore materially affect reported earnings between quarters.
Over the past 52 weeks, SEAMEC Ltd has traded between a low of ₹773.50 and a high of ₹1,845.00. The 52-week high and low indicate the stock’s price range over the last year and help investors understand its volatility and recent trading levels.
SEAMEC Ltd has a market capitalization of approximately 4,064.19. Market capitalization represents the total value of a company’s outstanding shares and helps investors understand its size, stability, and relative risk compared to other listed companies.
SEAMEC Ltd’s investment profile depends on its business fundamentals, valuation, and long-term outlook. The stock currently trades at a PE ratio of 12.12 and operates in the its sector sector. Investors typically assess financial performance, growth prospects, and individual risk tolerance before making investment decisions.
Based on its market capitalization of 4,064.19 Cr, SEAMEC Ltd is classified as a Small Cap stock. Large-cap stocks are generally more stable, while mid-cap and small-cap stocks tend to offer higher growth potential along with higher price volatility.
SEAMEC Ltd operates in the its sector sector. Sector classification matters because companies in the same sector are often affected by similar economic conditions, regulatory changes, and competitive dynamics, which can influence overall stock performance.
The Price-to-Earnings (PE) ratio of SEAMEC Ltd is 12.12. The PE ratio compares a company’s share price to its earnings and is commonly used to assess valuation. Comparing the PE ratio with sector peers and historical levels provides better context.
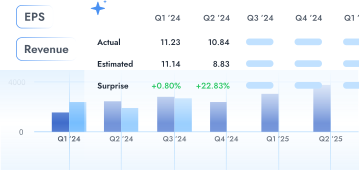
SEAMEC Ltd reported consolidated net revenue of ₹198.1 crore in Q2 FY27. The investor presentation said this was 103% higher than ₹97.4 crore in Q2 FY26.
They approved a special resolution authorising the sale, disposal, or leasing of assets exceeding 20% of the assets held by Seamec’s material subsidiary, enabling the SEAMEC GALLANT sale.
They approved a special resolution authorising the sale, disposal, or leasing of assets exceeding 20% of the assets held by Seamec’s material subsidiary.
Seamec’s Q1 FY27 earnings call is scheduled for Friday, August 14, 2026, at 11:30 AM IST.
| Symbol | Watchlist | Price | Market Cap | P/E | P/B | Div Yield (%) | ROE (%) | ROCE (%) | ROA (%) |
1598.50 | 4,064 Cr | 12.12 | 3.12 | 0.13 | 19.32 | 17.28 | 13.92 | ||
16.99 | 352 Cr | 3.86 | 0.00 | 0.00 | 0.71 | -17.35 | 28.70 | ||
155.50 | 341 Cr | -9.91 | 0.51 | 0.00 | -11.14 | -4.56 | -3.20 | ||
37.97 | 117 Cr | -11.38 | 0.93 | 0.00 | -12.02 | -5.47 | -4.98 | ||
20.43 | 74 Cr | 17.05 | 0.00 | 0.00 | -0.83 | -2.21 | 8.38 | ||
34.47 | 17 Cr | -53.87 | 0.00 | 0.00 | 16.21 | 0.93 | -4.73 | ||
10.49 | 15 Cr | -7.31 | 32.25 | 0.00 | -382.11 | -15.98 | -15.50 | ||
| Median: 7 Co. | — | 34.47 | 117 Cr | -7.31 | 0.51 | 0.00 | -0.83 | -4.56 | -3.20 |
Earnings Call/Transcript
SEAMEC released the audio recording of its Q2 FY27 earnings call held on November 4, 2026, with investors and analysts.
Investor Presentation
SEAMEC Ltd released its Q2 and H1 FY27 investor presentation, reporting consolidated H1 revenue of Rs 495 crore and PAT of Rs 132 crore, up 61% and 159% year-on-year, respectively.
Financial Results
SEAMEC approved unaudited standalone and consolidated financial results for the quarter and six months ended September 30, 2026, and reappointed MCS Share Transfer Agent as registrar for three years.
Product/Operations Update
SEAMEC Ltd’s vessel SEAMEC II commenced the PRP-8A and DSF 2 projects and was considered onhired from November 1, 2026, at 00:01 IST.
Earnings Call/Transcript
SEAMEC will hold its Q2 FY27 earnings call on November 4, 2026, at 11:00 a.m. IST, with senior management participating.
Board Meeting
SEAMEC’s Board will meet on November 3, 2026, to consider unaudited standalone and consolidated results for the quarter and six months ended September 30, 2026.