
Actions
Action Type





IRIS
Multibagg AI is an AI powered stock research and analysis platform. We provide data, information, content, and analytics for publicly traded Indian companies listed on NSE and BSE. AI can make mistakes, check important information.
Prices might be delayed by a few minutes.
Join our Exclusive Community


Join our Exclusive Community
Made with 💙 in India. © Finsky Technologies Pvt Ltd. 2026


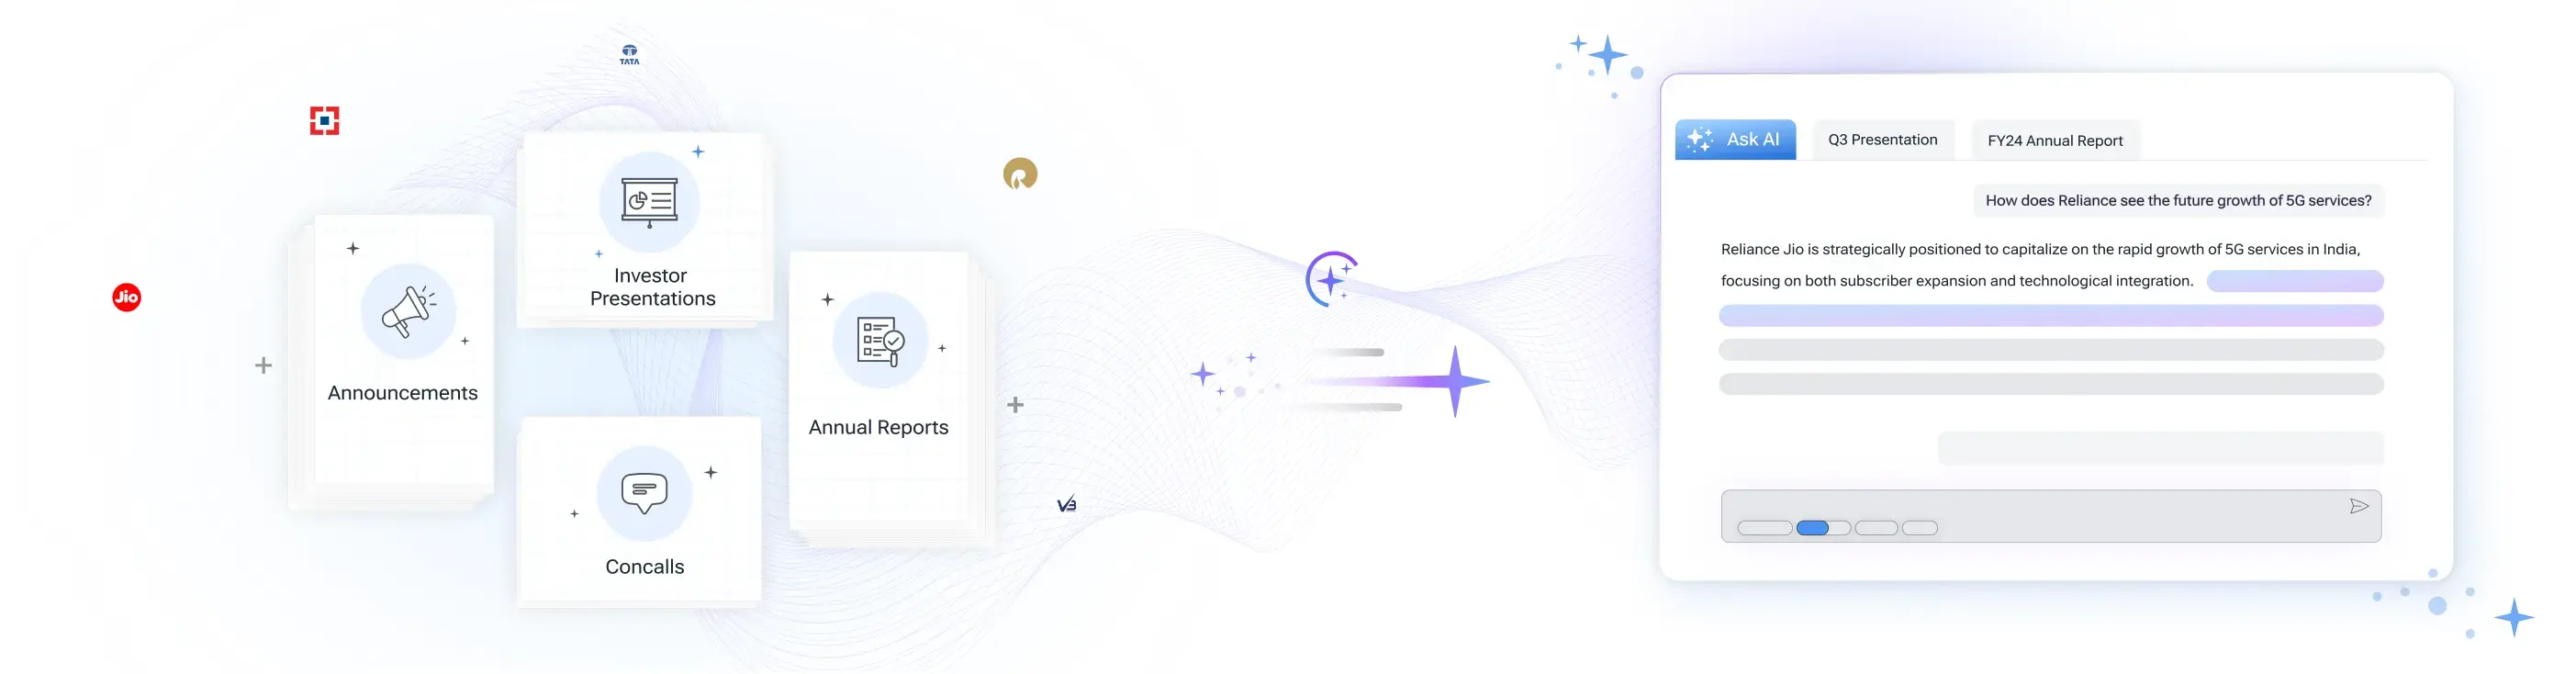
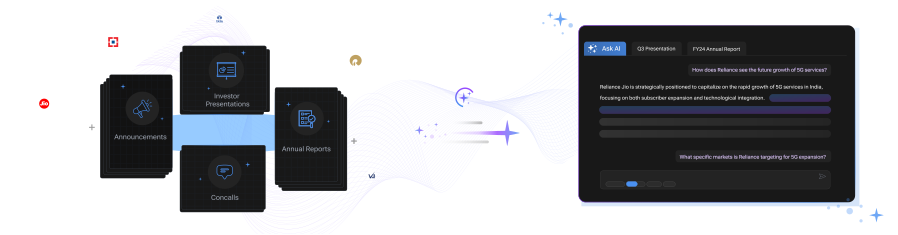
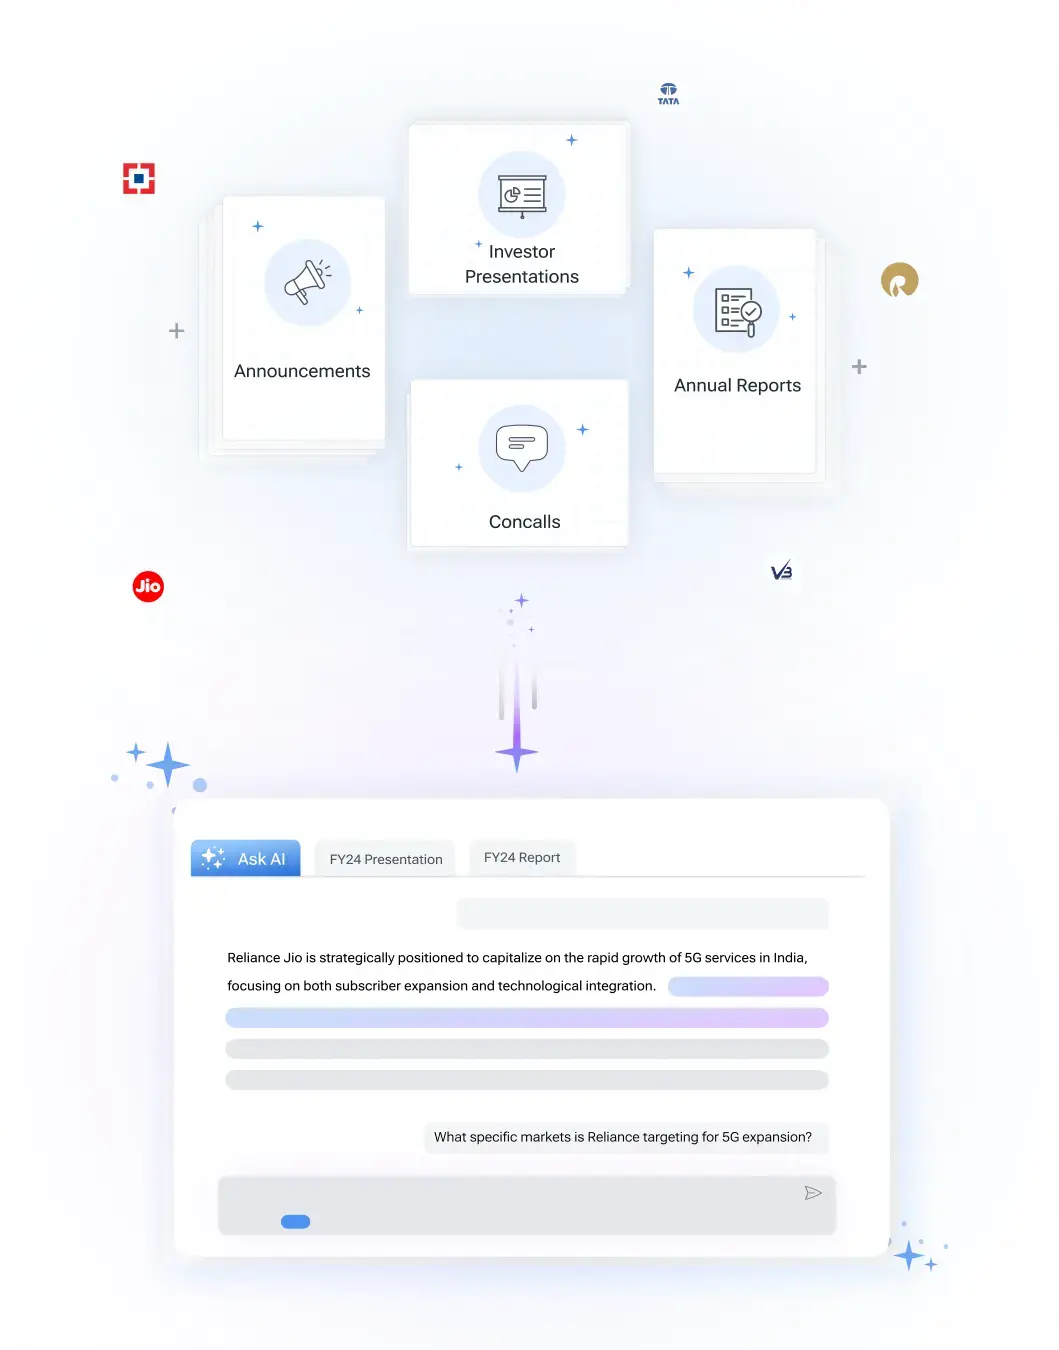
Get instant AI-powered insights about company performance, financials, and strategy. Ask questions about trends, competition, and developments while receiving responses backed by official documents and market data, with clear attribution to source documents.

Bearish
2
Neutral
6
Bullish
6
Bearish
34
Neutral
6
Bullish
6
Bearish
32
Neutral
0
Bullish
0
Bearish
32
Neutral
0
Bullish
0
Bearish
32
Neutral
0
Bullish
0
Bearish
32
Neutral
0
Bullish
0
 Discovery themes featuring this stock
View Standalone
View Standalone
View Standalone
View Standalone
View Standalone
View Standalone
View Standalone
View Standalone



Investor Presentation
Q2 FY27
Investor Presentation
Q2 FY26


TGB Banquets & Hotels Ltd (TGBHOTELS) is currently trading at 9.05 per share. Stock prices fluctuate during market hours on NSE and BSE based on demand, company updates, and overall market conditions. Refer to the live price chart above for the most recent price movement.
TGB Banquets & Hotels Limited operates a hospitality business focused on banquets, hotels and conventions, anchored by The Grand Bhagwati hotel in Ahmedabad; core offering emphasizes large-scale banqueting capacity alongside rooms, restaurants and F&B, with operations reported as a single Hospitality/Hotels segment in the investor presentation. For the half year ended September 30, 2026 the company reported total income of Rs. 1,449.91 lakhs, with revenue from operations of Rs. 1,375.08 lakhs, down materially year-on-year from Rs. 1,805.23 lakhs; net profit fell to Rs. 29.29 lakhs versus Rs. 39.00 lakhs a year earlier, signalling margin pressure amid lower top-line. Operating cash flow turned positive at Rs. 314.17 lakhs for H1 FY27 versus a cash outflow of Rs. 305.83 lakhs in H1 FY26, driven by working capital movement; the balance sheet shows significant current asset 'Loans' of Rs. 3,432.25 lakhs and Other Current Assets of Rs. 3,209.00 lakhs, which merit clarity on collectability and counterparty exposure. Equity is reported at Rs. 7,785.38 lakhs against total assets of Rs. 10,854.82 lakhs, with modest borrowings; notable liabilities include sizeable current tax liabilities of Rs. 1,629.93 lakhs and lease liabilities of Rs. 475.76 lakhs, which could constrain cash deployment and require management guidance on timing and provisioning. Commercial differentiation relies on large banquet scale—three halls able to host about 5,400 persons on two shifts—and a positioning around indigenous ‘Responsible Luxury’ hospitality; this niche attracts large events and weddings but also concentrates demand geographically in Ahmedabad, raising exposure to local demand cycles and seasonality.
Over the past 52 weeks, TGB Banquets & Hotels Ltd has traded between a low of ₹7.60 and a high of ₹12.26. The 52-week high and low indicate the stock’s price range over the last year and help investors understand its volatility and recent trading levels.
TGB Banquets & Hotels Ltd has a market capitalization of approximately 26.33. Market capitalization represents the total value of a company’s outstanding shares and helps investors understand its size, stability, and relative risk compared to other listed companies.
TGB Banquets & Hotels Ltd’s investment profile depends on its business fundamentals, valuation, and long-term outlook. The stock currently trades at a PE ratio of -18.67 and operates in the its sector sector. Investors typically assess financial performance, growth prospects, and individual risk tolerance before making investment decisions.
Based on its market capitalization of 26.33 Cr, TGB Banquets & Hotels Ltd is classified as a Small Cap stock. Large-cap stocks are generally more stable, while mid-cap and small-cap stocks tend to offer higher growth potential along with higher price volatility.
TGB Banquets & Hotels Ltd operates in the its sector sector. Sector classification matters because companies in the same sector are often affected by similar economic conditions, regulatory changes, and competitive dynamics, which can influence overall stock performance.
The Price-to-Earnings (PE) ratio of TGB Banquets & Hotels Ltd is -18.67. The PE ratio compares a company’s share price to its earnings and is commonly used to assess valuation. Comparing the PE ratio with sector peers and historical levels provides better context.
The board meeting is scheduled for Monday, May 18, 2026 at 04:30 PM.


TGB Banquets & Hotels Limited operates a hospitality business focused on banquets, hotels and conventions, anchored by The Grand Bhagwati hotel in Ahmedabad; core offering emphasizes large-scale banqueting capacity alongside rooms, restaurants and F&B, with operations reported as a single Hospitality/Hotels segment in the investor presentation.
For the half year ended September 30, 2026 the company reported total income of Rs. 1,449.91 lakhs, with revenue from operations of Rs. 1,375.08 lakhs, down materially year-on-year from Rs. 1,805.23 lakhs; net profit fell to Rs. 29.29 lakhs versus Rs. 39.00 lakhs a year earlier, signalling margin pressure amid lower top-line.
Operating cash flow turned positive at Rs. 314.17 lakhs for H1 FY27 versus a cash outflow of Rs. 305.83 lakhs in H1 FY26, driven by working capital movement; the balance sheet shows significant current asset 'Loans' of Rs. 3,432.25 lakhs and Other Current Assets of Rs. 3,209.00 lakhs, which merit clarity on collectability and counterparty exposure.
Equity is reported at Rs. 7,785.38 lakhs against total assets of Rs. 10,854.82 lakhs, with modest borrowings; notable liabilities include sizeable current tax liabilities of Rs. 1,629.93 lakhs and lease liabilities of Rs. 475.76 lakhs, which could constrain cash deployment and require management guidance on timing and provisioning.
Commercial differentiation relies on large banquet scale—three halls able to host about 5,400 persons on two shifts—and a positioning around indigenous ‘Responsible Luxury’ hospitality; this niche attracts large events and weddings but also concentrates demand geographically in Ahmedabad, raising exposure to local demand cycles and seasonality.
Leisure Services
Hotels & Resorts
26 Cr
Low Risk
-18.7
37.6
1.6
0.3
12.26
7.60
Sales CAGR
Profit CAGR
ROE
ROCE
| Symbol | Watchlist | Price | Market Cap | P/E | P/B | Div Yield (%) | ROE (%) | ROCE (%) | ROA (%) |
845.50 | 28 Cr | -51.63 | 0.36 | 0.00 | -0.70 | -0.50 | -0.67 | ||
9.05 | 26 Cr | -18.67 | 0.34 | 0.00 | 1.72 | 2.94 | 1.23 | ||
7.68 | 25 Cr | 31.70 | 0.00 | 0.00 | 2.85 | 12.18 | 0.43 | ||
13.05 | 25 Cr | 8.69 | 0.82 | 0.00 | 9.45 | 9.82 | 3.91 | ||
14.70 | 24 Cr | 1221.50 | 10.38 | 0.00 | 0.40 | 4.59 | 0.33 | ||
17.90 | 23 Cr | 8.92 | 0.40 | 0.00 | 4.40 | 6.15 | 3.56 | ||
53.30 | 22 Cr | 45.37 | 2.58 | 0.00 | 2.43 | 4.06 | 1.71 | ||
| Median: 7 Co. | — | 14.70 | 25 Cr | 8.92 | 0.40 | 0.00 | 2.43 | 4.59 | 1.23 |


