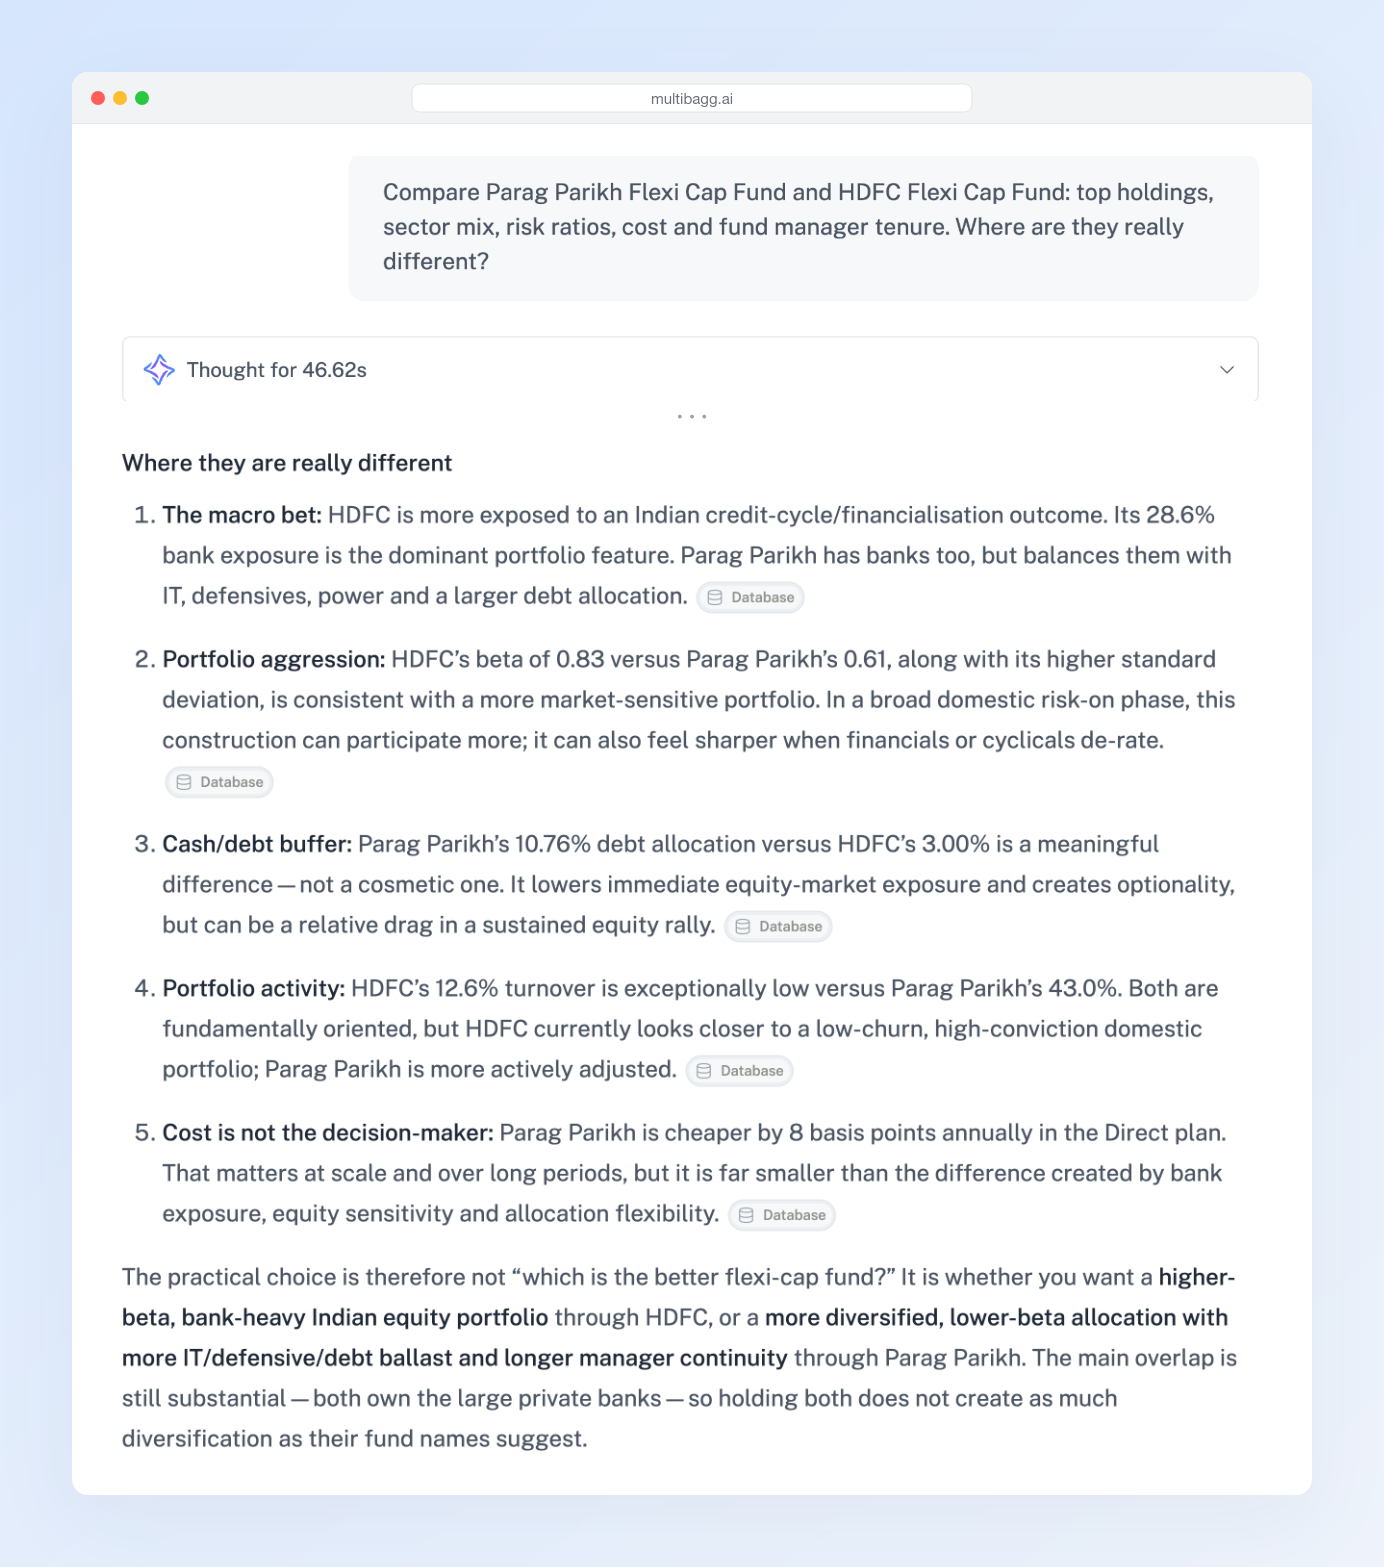
Last week I typed one question into Iris, our AI analyst:
"I invest in Mirae Asset Large Cap Fund, Kotak Flexi Cap Fund and HDFC Focused Fund. How much do their holdings overlap? Am I really diversified?"
Fifty-four seconds later, this came back.
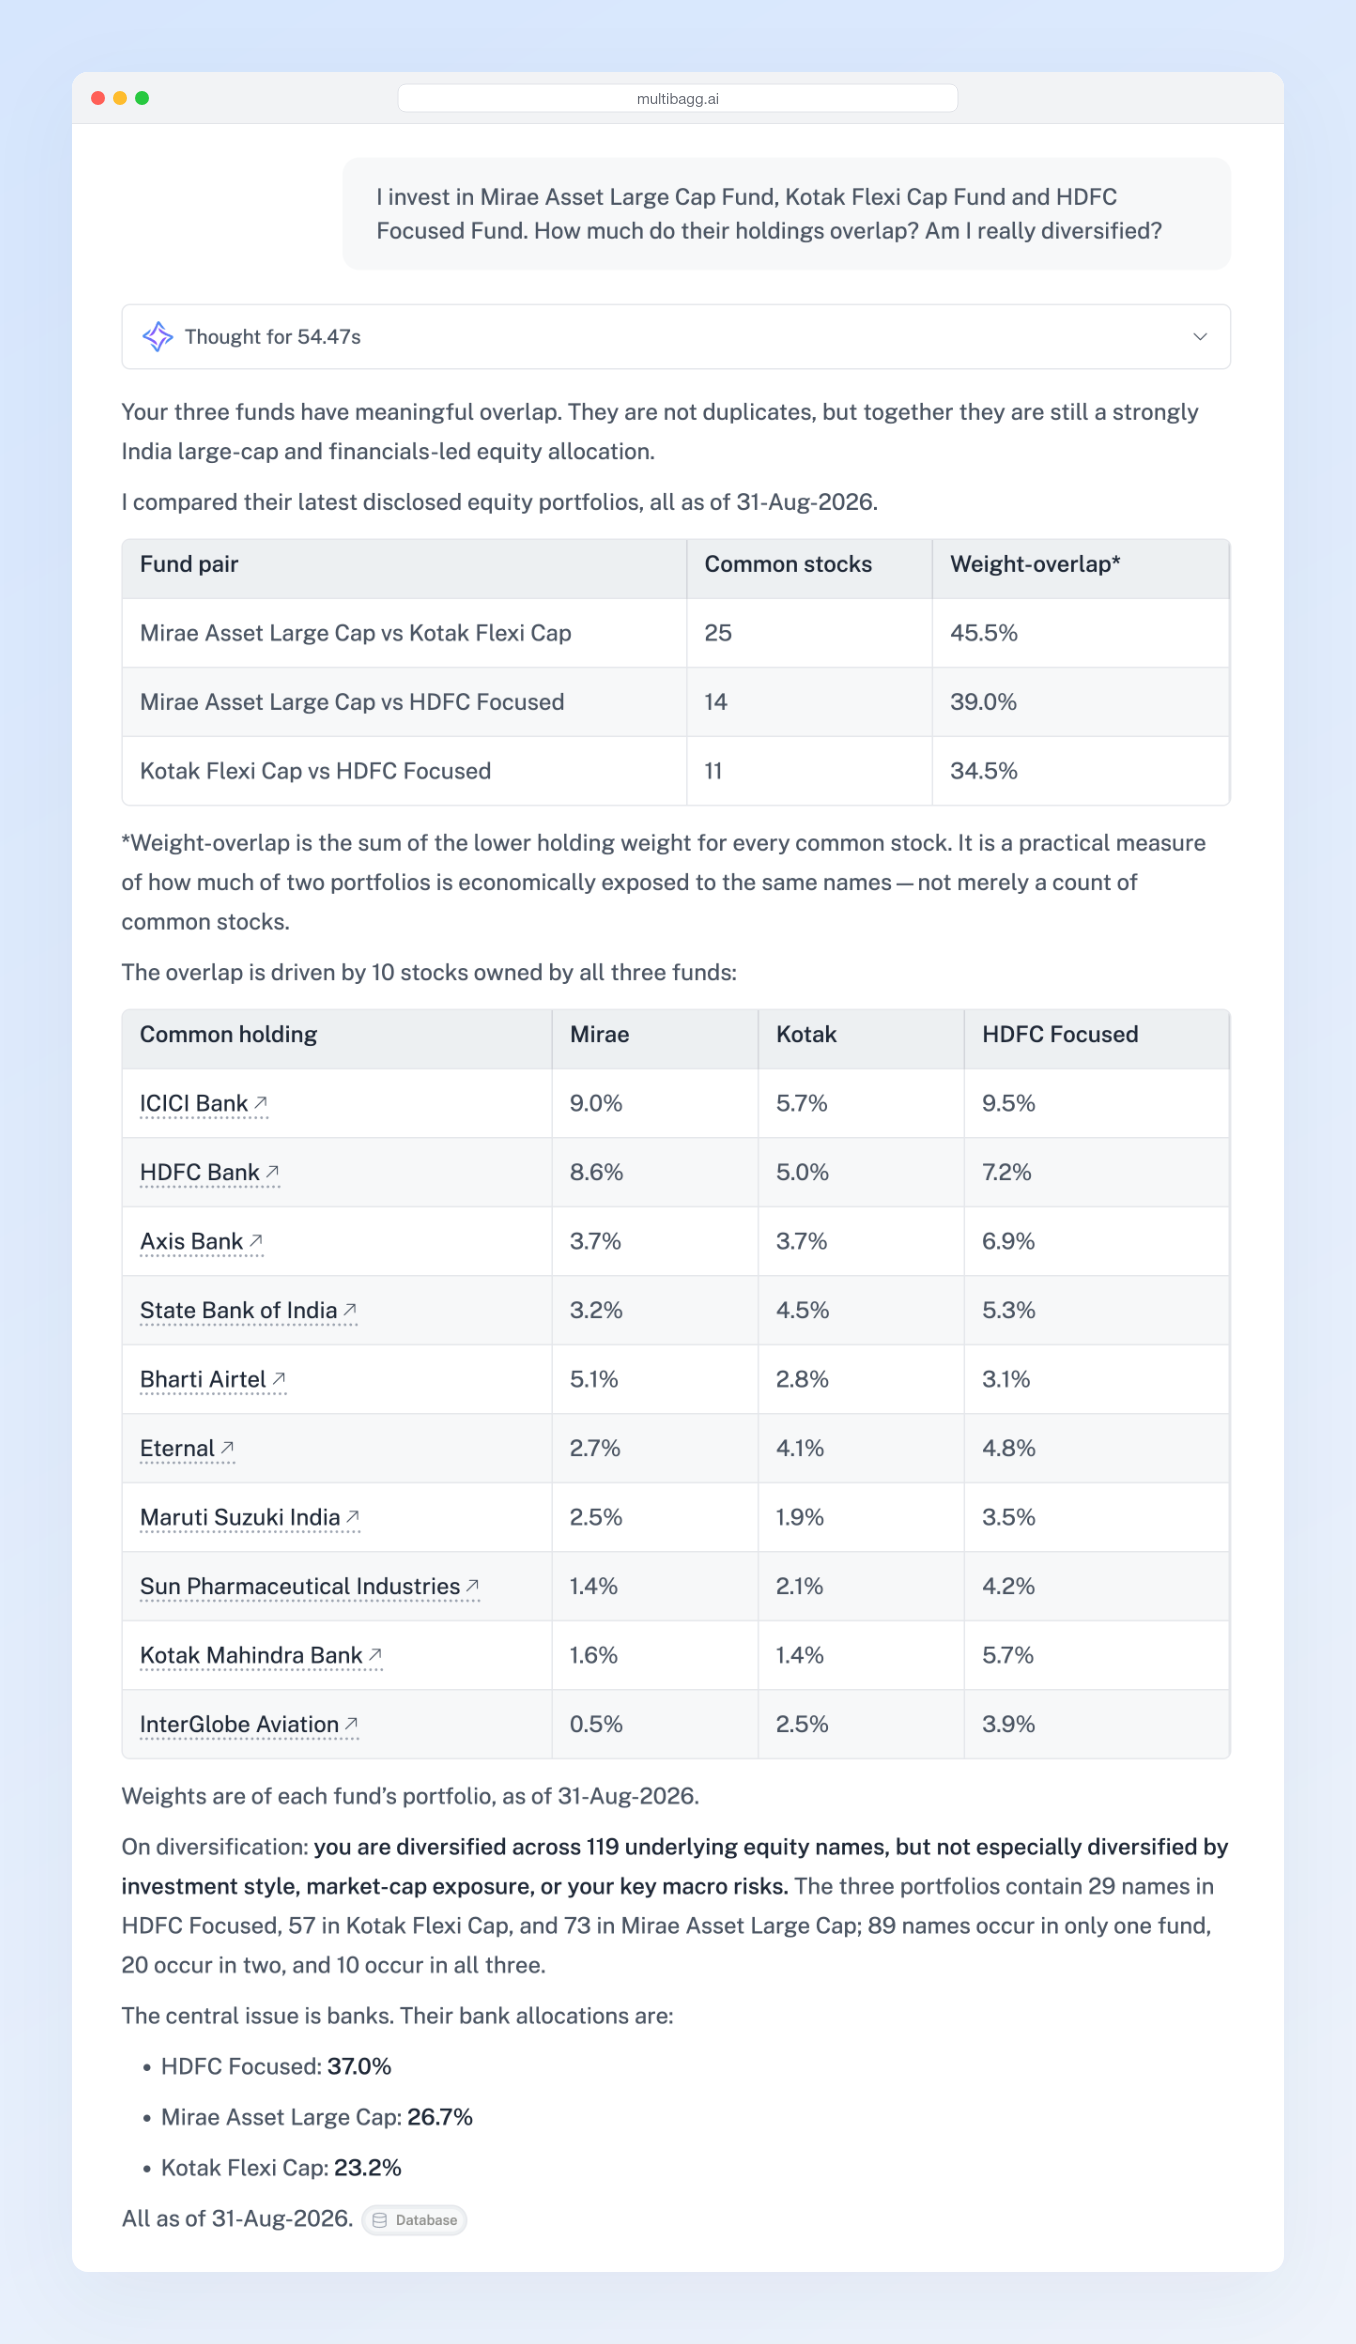
Ten stocks are in all three funds. Mirae and Kotak alone share 25 stocks. Banks are 37% of HDFC Focused, 27% of Mirae and 23% of Kotak.
Three fund houses. Three fund managers. Three categories. Three SIPs leaving your account every month. And, in Iris's words, "not three independent equity return engines." When Indian banks have a bad year, all three funds will have a bad year together.
Here is the part that bothers me.
Many Indian investors hold some version of this portfolio. Almost all of them bought it inside an app that showed them each fund's returns, ratings and charts. Very few of them were ever shown this answer.
Not because the answer is hard to find. Because nobody inside that app has a reason to show it to you. If you knew, you might buy fewer funds.
Find the button
Open the app you bought your funds on.
Pick any fund. Look at the screen for five seconds.
Somewhere on it, probably at the bottom, probably green, probably the biggest button on the page, is a button that says Invest.
Stay with that button for a moment. It is the most honest thing on the screen. It tells you what the screen is for.
You would never ask a property broker whether now is a good time to buy a flat. Not because brokers are bad people. Most are not. You don't ask because you already know which answer pays them.
With mutual funds, we do exactly that, every day, without noticing. The app where we research a fund is the same app where we buy it. The review section and the checkout counter are on the same page.
I am not saying these apps lie to you. The NAVs are correct. The returns are correct. The people who build them are smart, and many of them care about investors.
But a business that earns when you buy will always, quietly, shape what you see before you buy. It does not need to lie. It only needs to decide what goes first, and what never shows up at all.
The incentives are not secret:
Some of the biggest investing apps in India now own their own fund houses. The app shows you funds, and the same group also makes funds. Ask yourself whose fund gets the better shelf.
Banks and distributors earn a trail commission on regular plans, every year, for as long as you stay invested. That commission comes out of your returns.
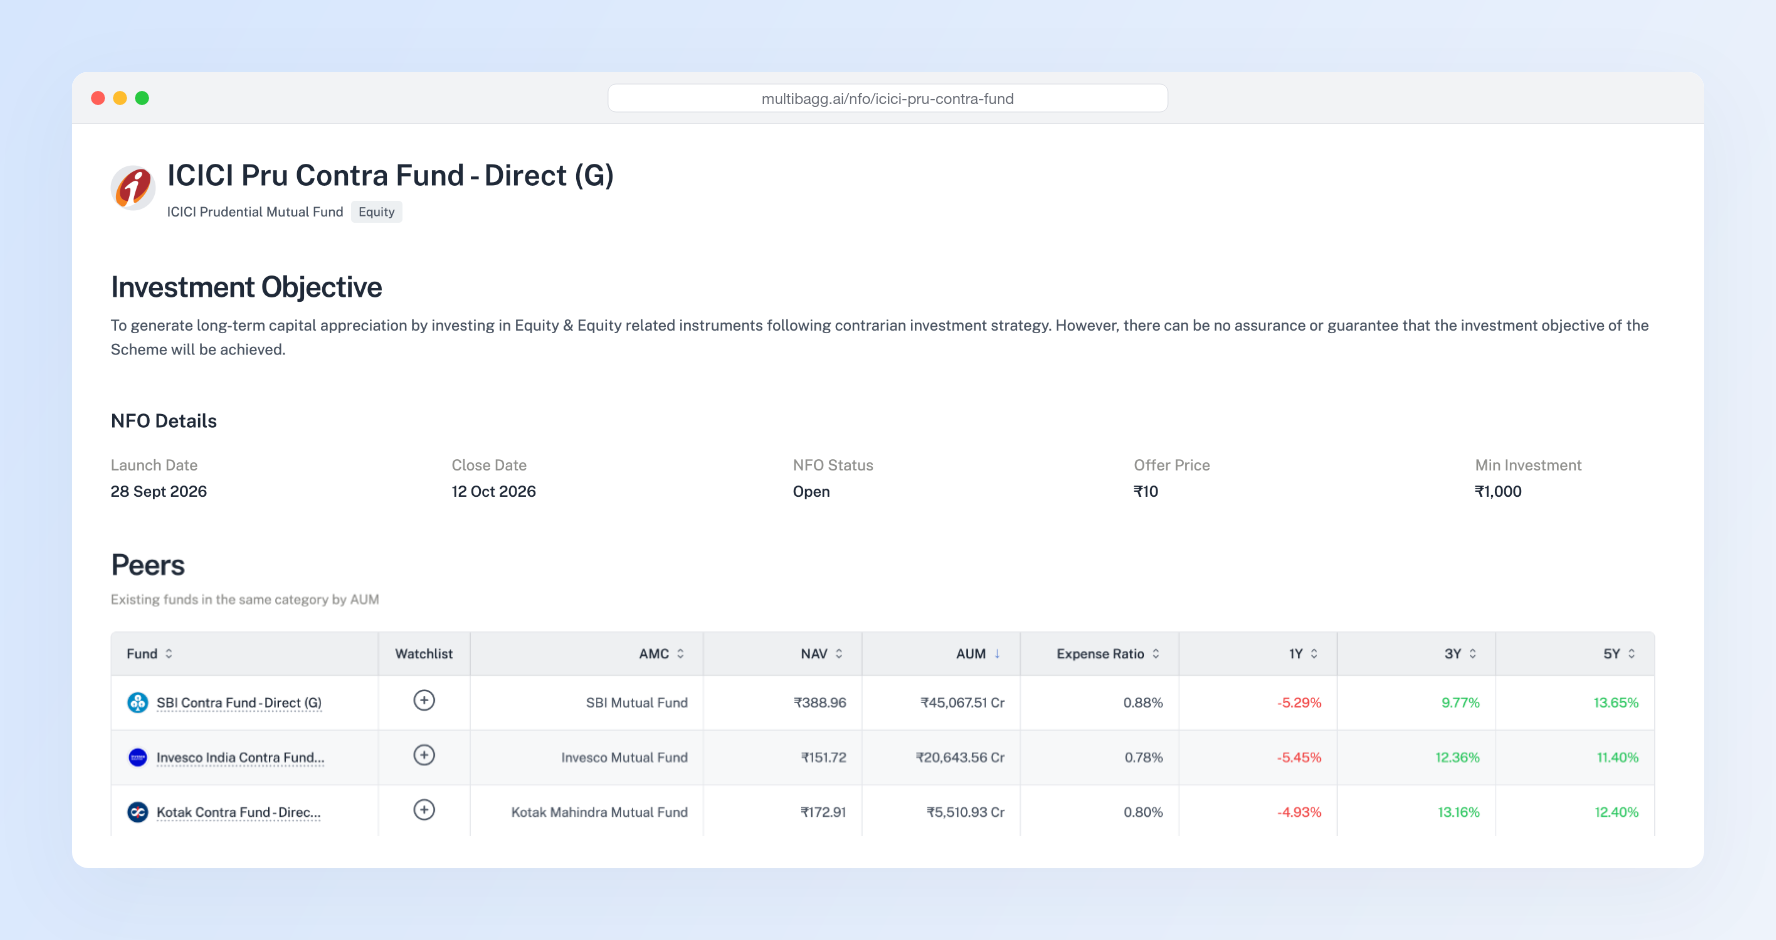
Every shop has a shelf. "Popular funds." "Top picks." "Trending." "New fund offer, invest before it closes." Someone decides what sits at eye level. That someone is not you.
How much does the second one cost? I asked Iris that too.
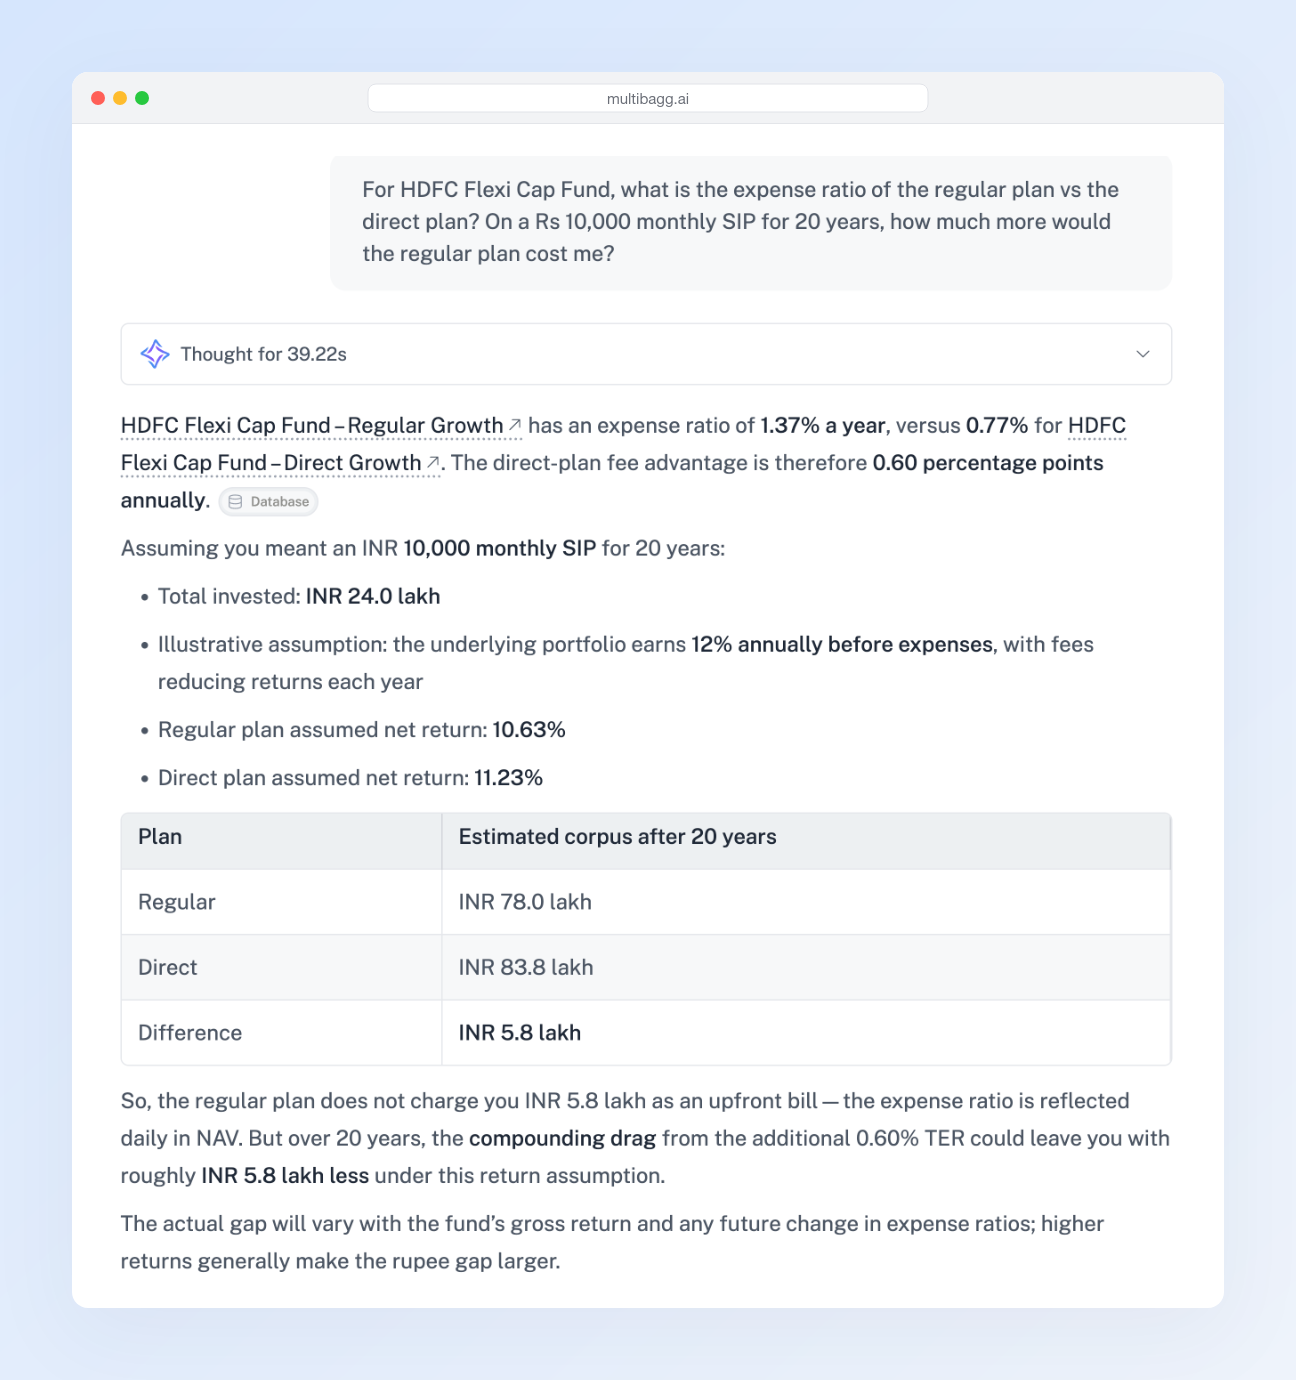
The same fund, the same manager, the same stocks. The regular plan of HDFC Flexi Cap charges 1.37% a year. The direct plan charges 0.77%. On a ₹10,000 monthly SIP for 20 years, that gap is about ₹5.8 lakh less in your pocket.
The person who sells you the regular plan is paid from that gap. That is the one conversation they are least likely to start.
None of this is a scandal. It is just business. But it means the research you read on those screens can never be fully neutral. It cannot be. The incentive is built into the floor plan.
So we built it with nothing to sell
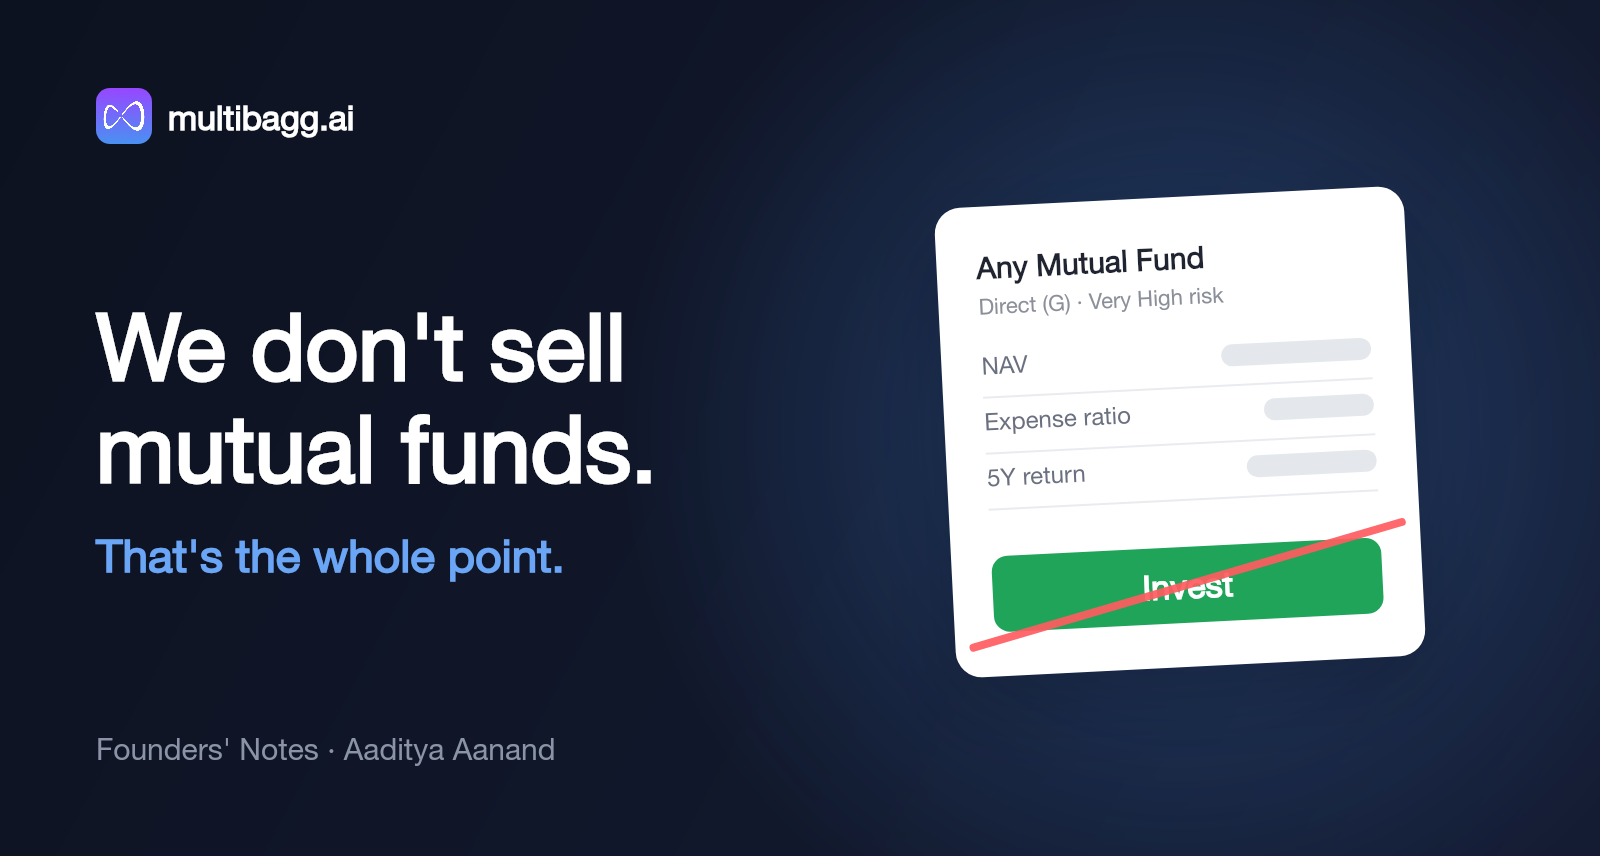
At Multibagg AI, we do not sell mutual funds.
We do not earn a commission. We do not own a fund house. We do not have an Invest button. No fund house pays us to show their fund first. We make money in one way: investors who find our research useful pay for it.
That gave us a rare freedom. We could ask one simple question for every screen we built:
If we had nothing to sell, what would an investor actually need to see here?
We did not want to add opinions. We do not give star ratings, and we do not have a "recommended" list. Our job is to put the right data in front of you, in the right order, and then get out of the way.
Here is what we built, one problem at a time.
(The funds in this note are examples. I picked them because they are large and well known. This is not a comment on any of them, good or bad.)
I own three funds, so I'm diversified.
Iris told you the answer in words. Compare Funds lets you see it for yourself.
Put up to three funds side by side and see everything in one place: NAV growth, returns over every period, expense ratio, exit load, risk ratios, fund managers and, most important, their top holdings next to each other.
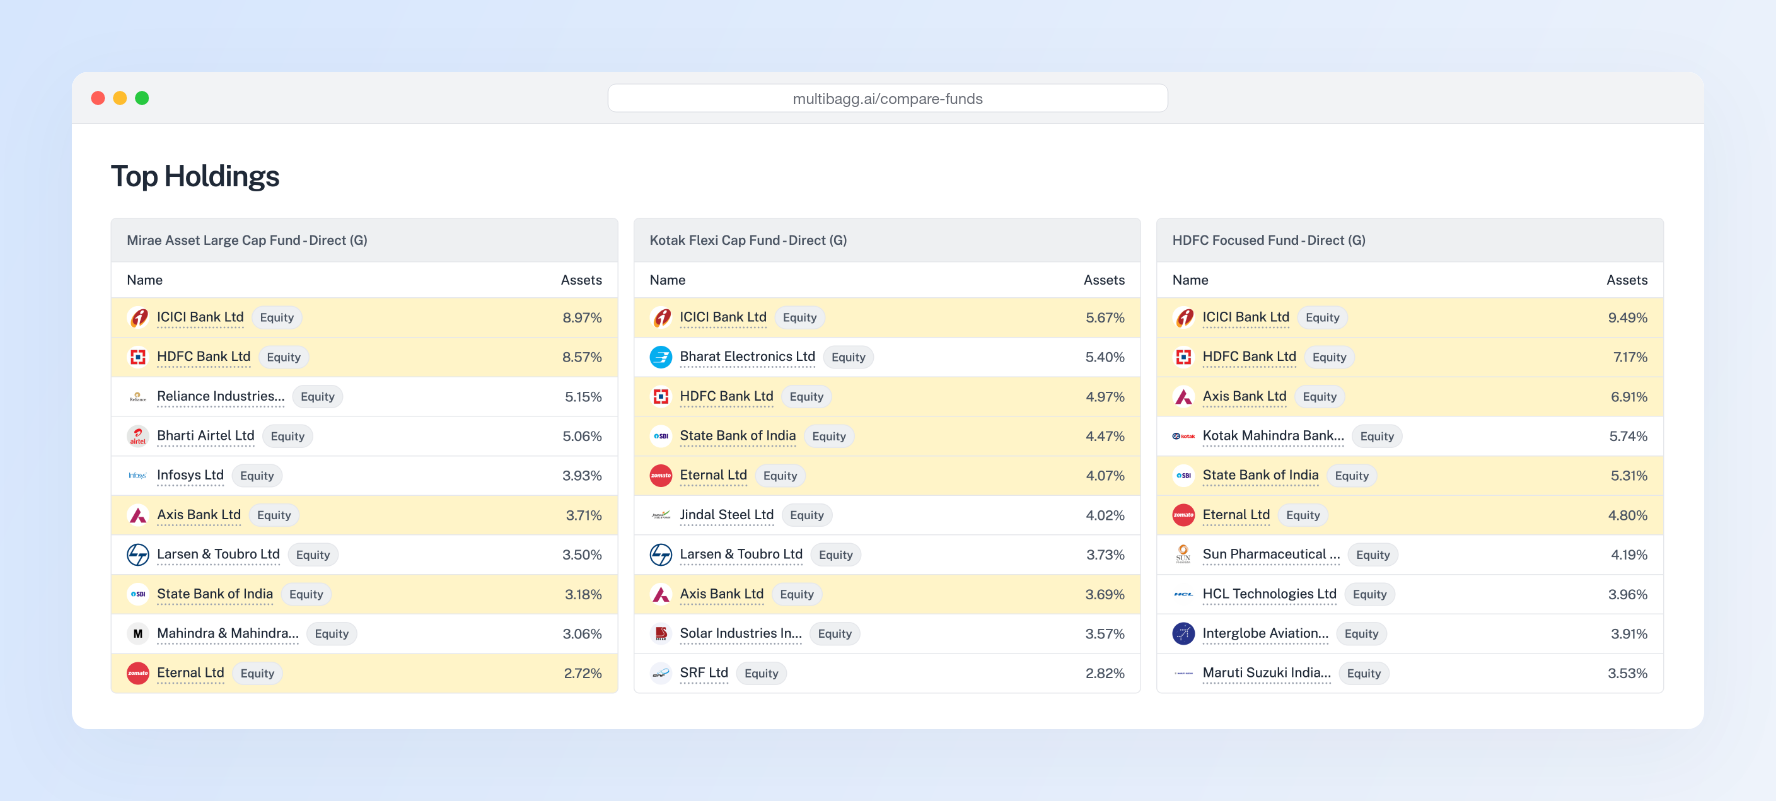
Look at the top ten of each fund. ICICI Bank, HDFC Bank, Axis Bank, State Bank of India and Eternal are in all three. Those five stocks alone are 27% of the Mirae fund, 23% of the Kotak fund and 34% of the HDFC fund.
Then look at how the three funds moved over five years.
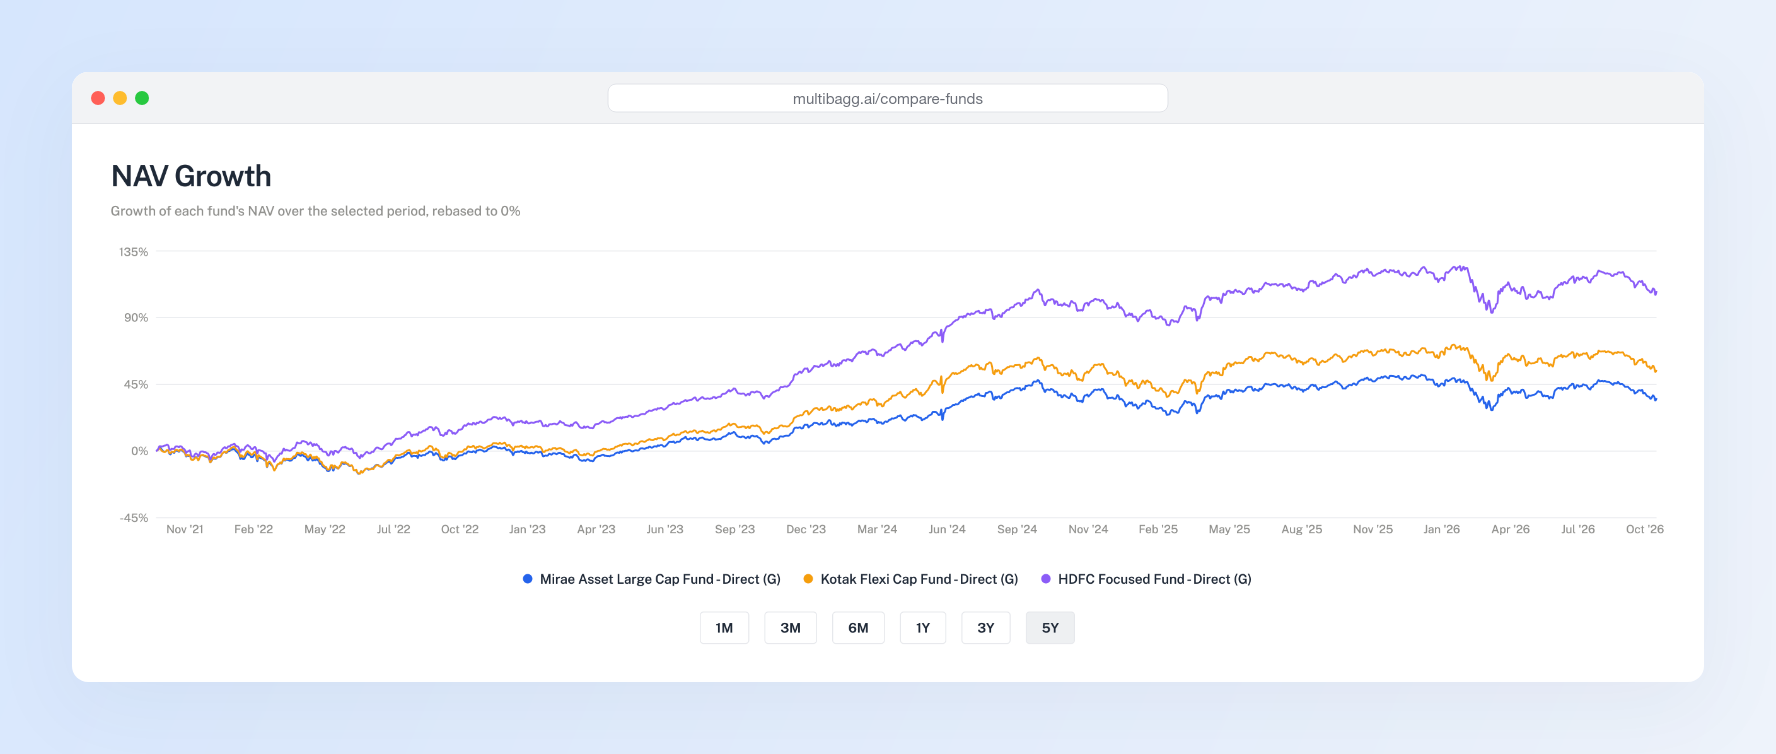
The lines are at different heights, but they rise together, fall together and recover together. You see the overlap at once. You do not need anyone to tell you what it means.
What does my fund actually own?
Most fund screens show you a pie chart of sectors and a short list of top 10 names. Then the trail ends.
But a fund is its holdings. If you would not buy a stock directly, you should know when your fund holds a large position in it.
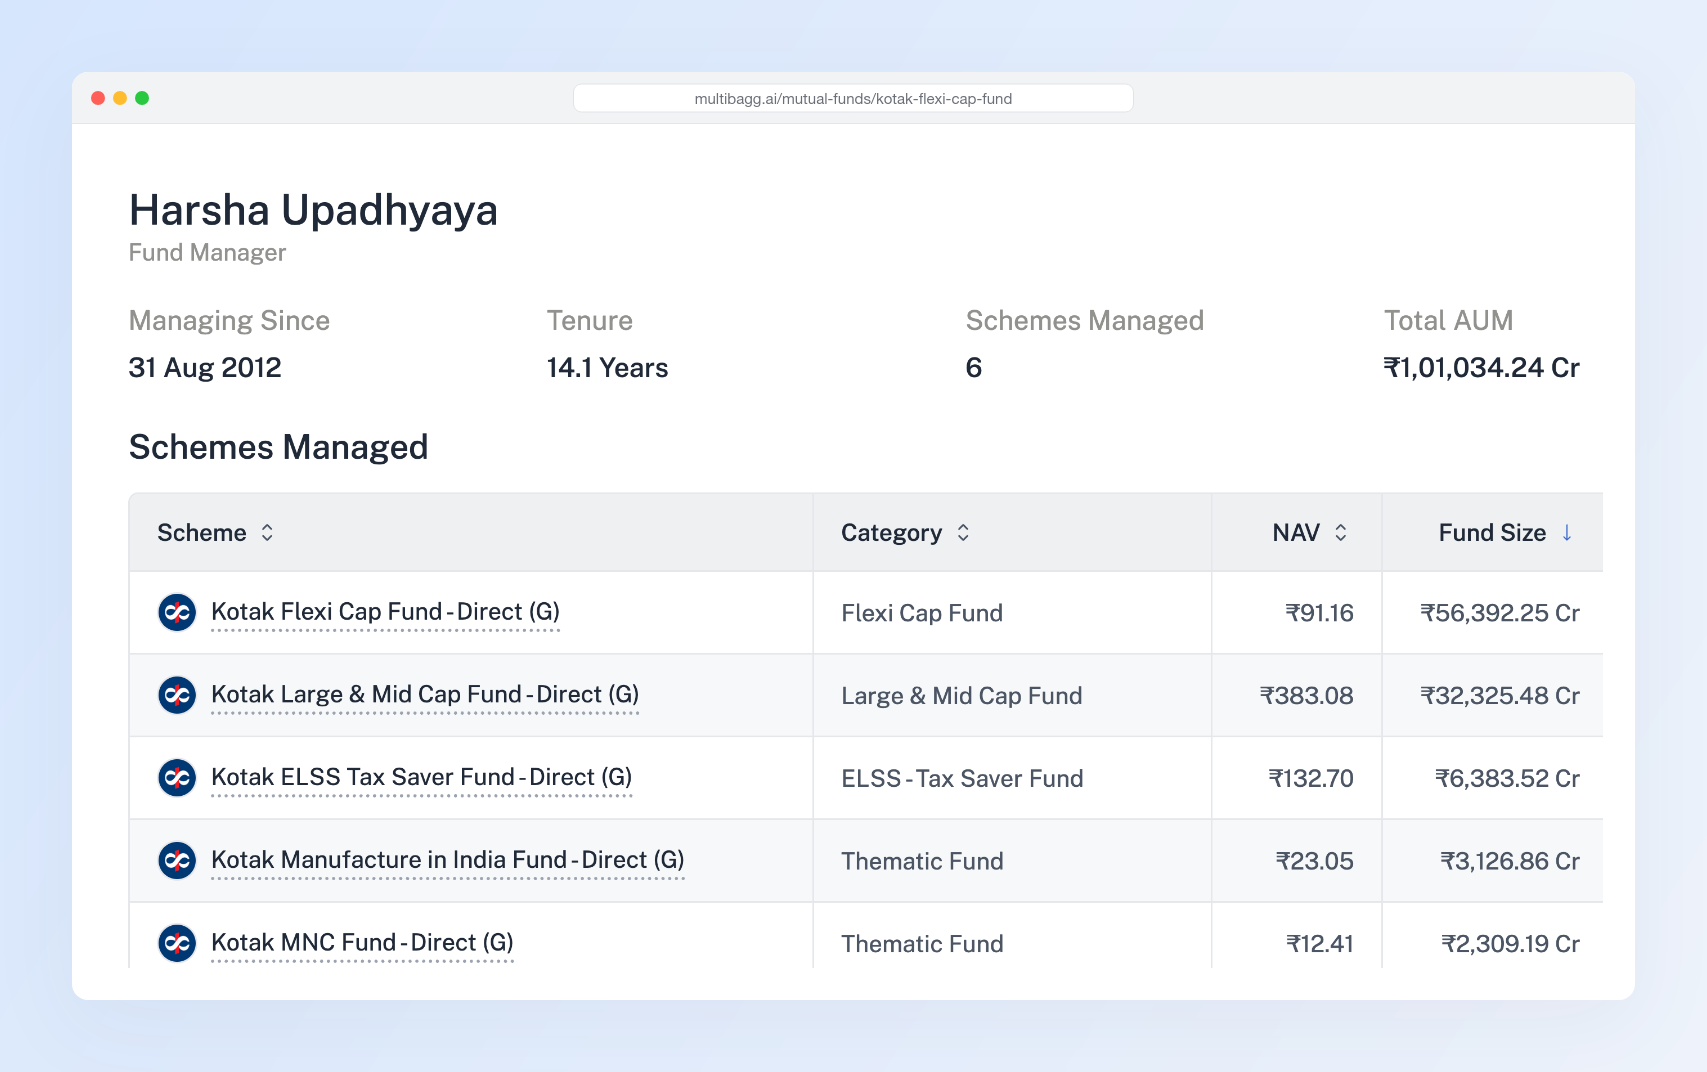
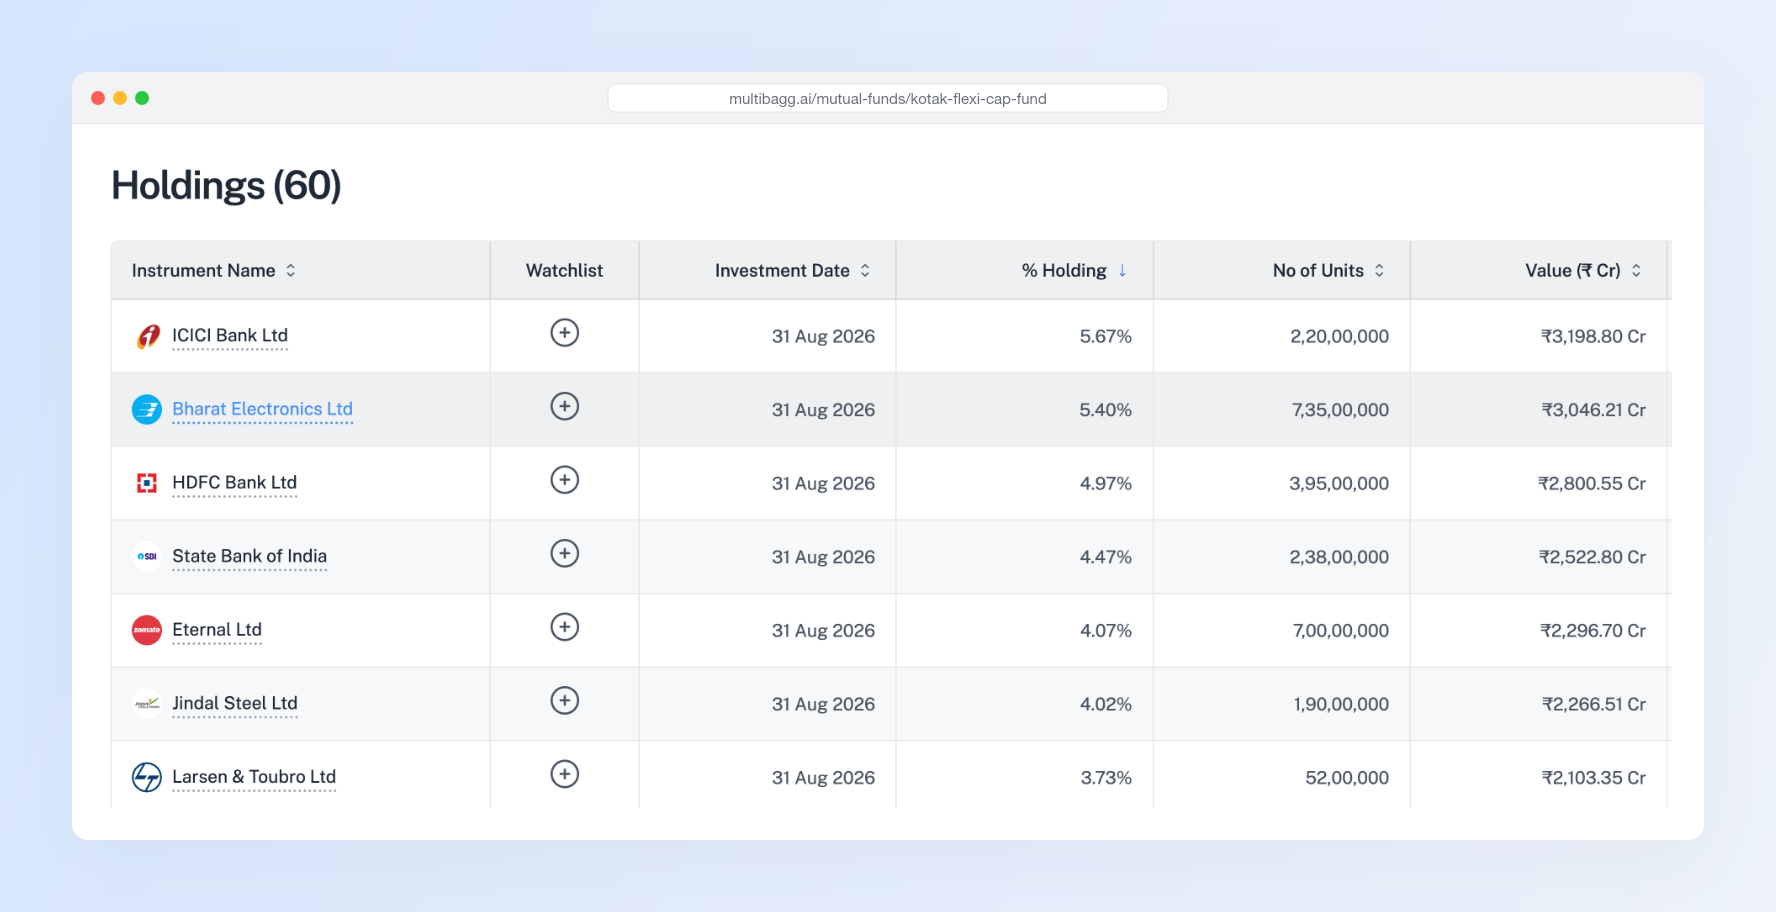
On multibagg.ai you see every holding, all 60 of them for Kotak Flexi Cap, with the number of shares, the value and the date. Every stock links to its full research: financials, annual reports, concall transcripts, red flags and Iris. You can go from "my fund holds 5.4% in Bharat Electronics" to "this is what Bharat Electronics' management said on last quarter's call" in two clicks.
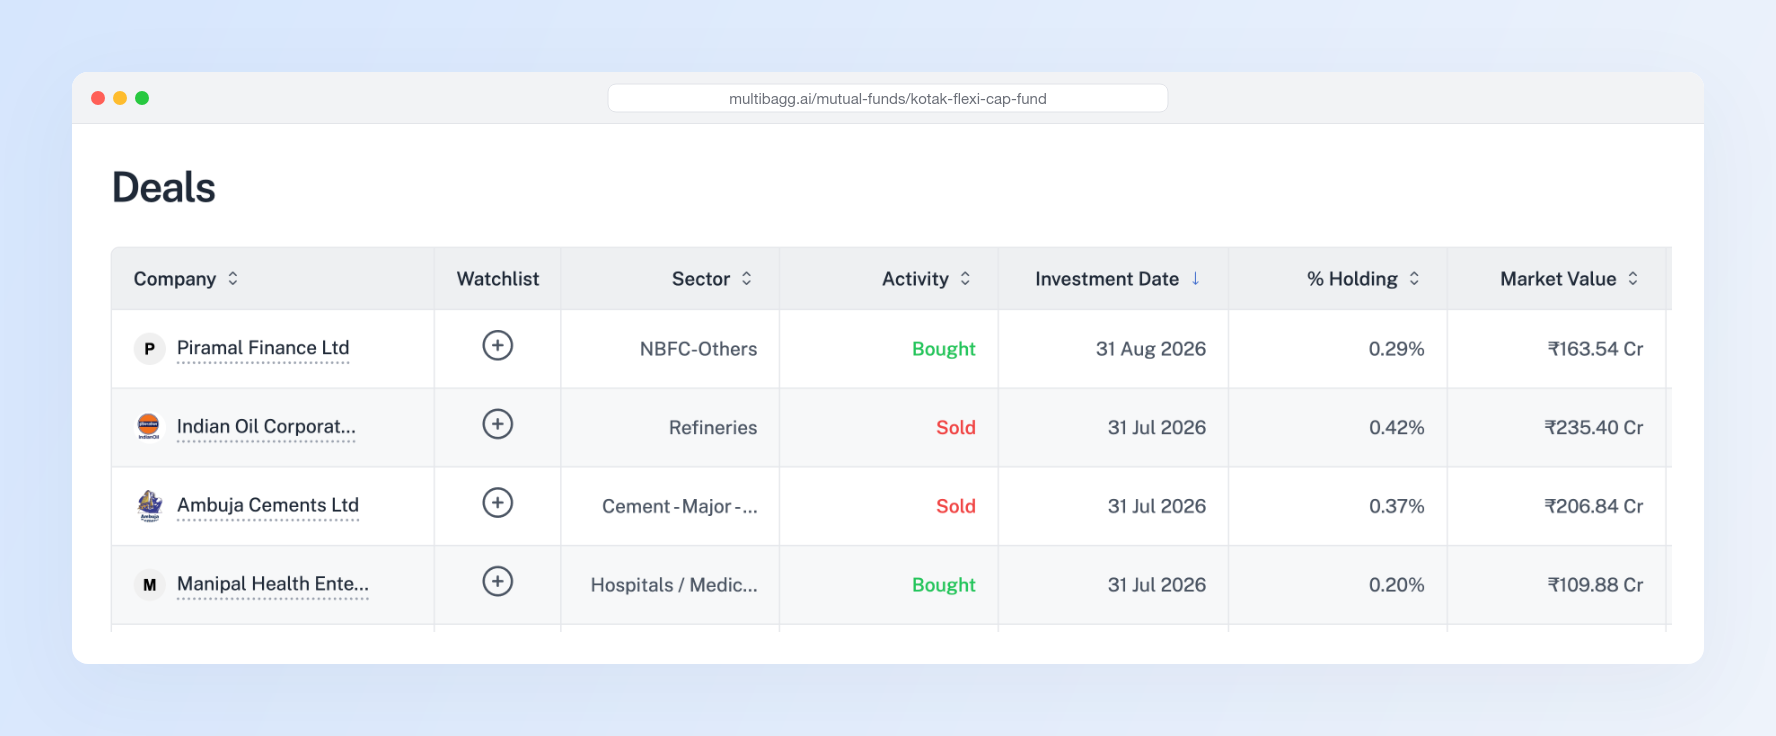
We also show you Deals: what the fund bought and what it sold, month by month. Over three months, Kotak Flexi Cap bought into Piramal Finance and Manipal Health, and sold its positions in Indian Oil, Ambuja Cements, Hindalco and KEC International. These are the fund manager's actual decisions, without any commentary on top.
It fell 6% last year. Should I worry?
A return number alone tells you almost nothing.
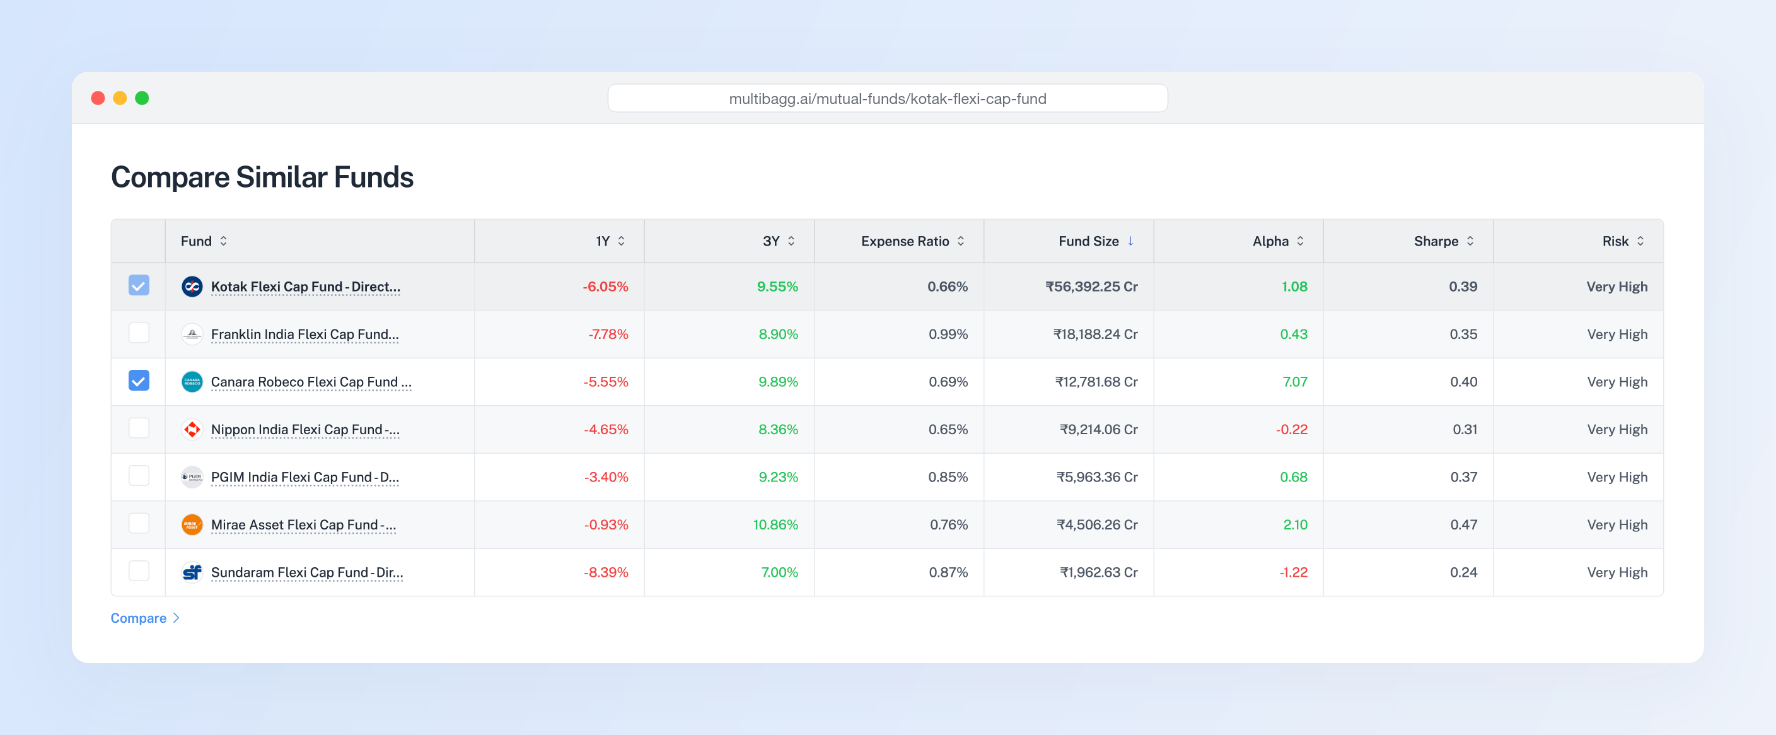
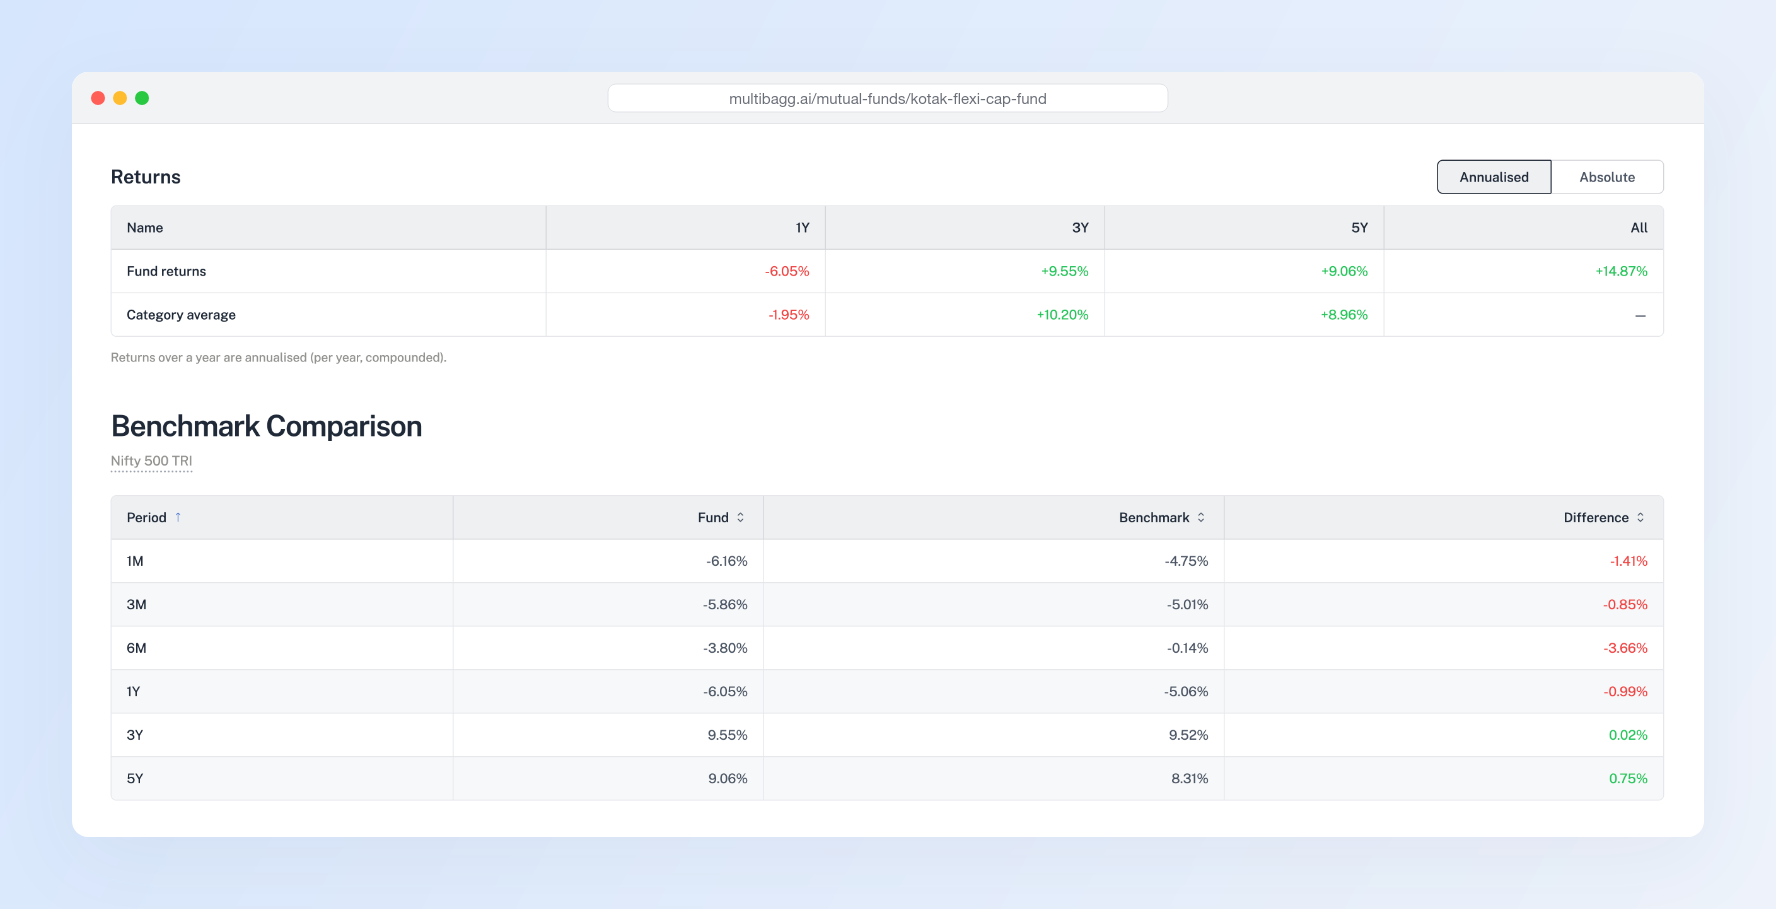
Kotak Flexi Cap returned −6.05% over the last year. Taken alone, that number is just scary. With context, it becomes useful:
The average flexi cap fund returned −1.95%. So the fund trailed its peers by about 4 points last year.
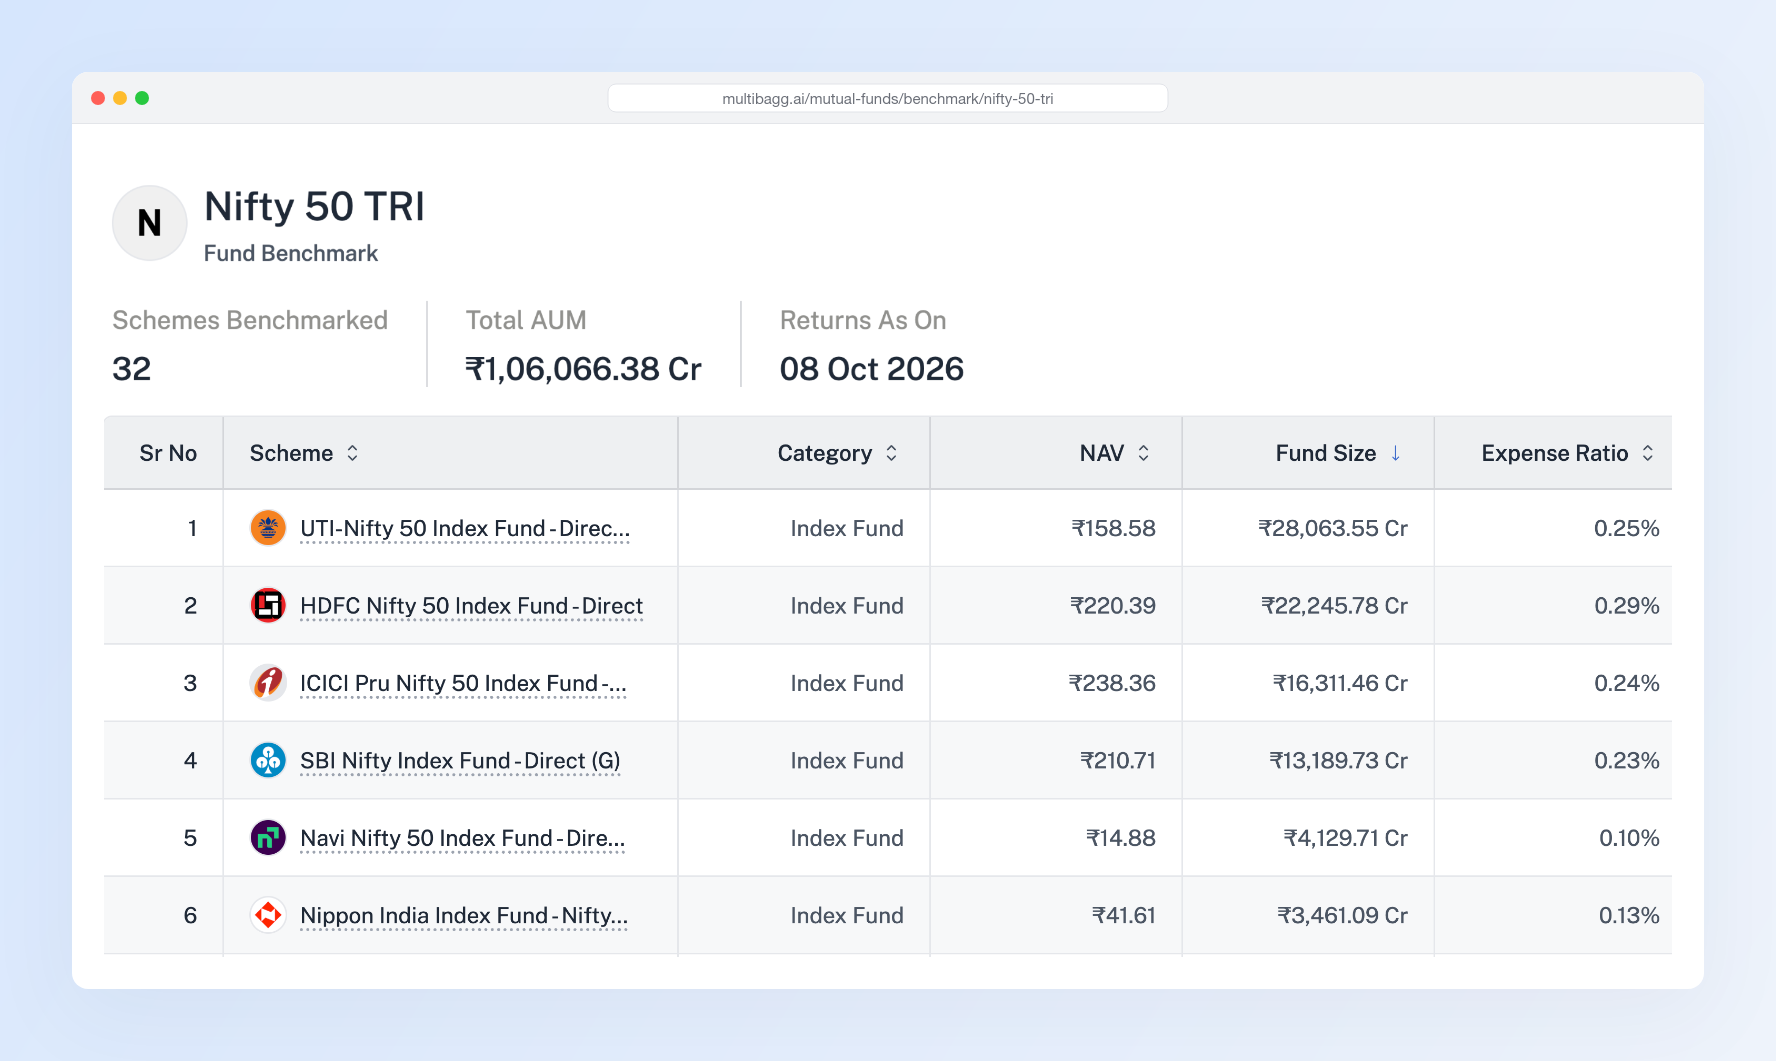
Its benchmark, the Nifty 500 TRI, returned −5.06%. So against the market it tracks, it trailed by about 1 point.
Over five years, the fund returned 9.06% a year, ahead of both the category (8.96%) and the benchmark (8.31%).
Two investors can read those numbers and make two different decisions. Both can be right. What is not right is making the decision from one red number on a fund card.
So we never show a return alone. Every number sits next to the category average and the benchmark. You also get the riskometer, the fund's volatility against its benchmark, and its returns year by year, so one great year cannot hide three average ones. Alpha, beta, Sharpe ratio, standard deviation: they are all there, not behind a "pro" tab.