










Aeron Composite FY26 returns fell as debt and days rose
Key highlights
- Aeron’s FY26 EBITDA margin fell to 6.6% from 8.5% in FY25.
- FY26 PAT declined to Rs 7.6 crore from Rs 13.5 crore in FY25.
- Net debt reached Rs 25.99 crore in FY26 after net cash of Rs 19 lakh in FY25.
- Aeron’s implied operating cycle increased to 82 days in FY26 from 72 days in FY25.
powered by IRIS
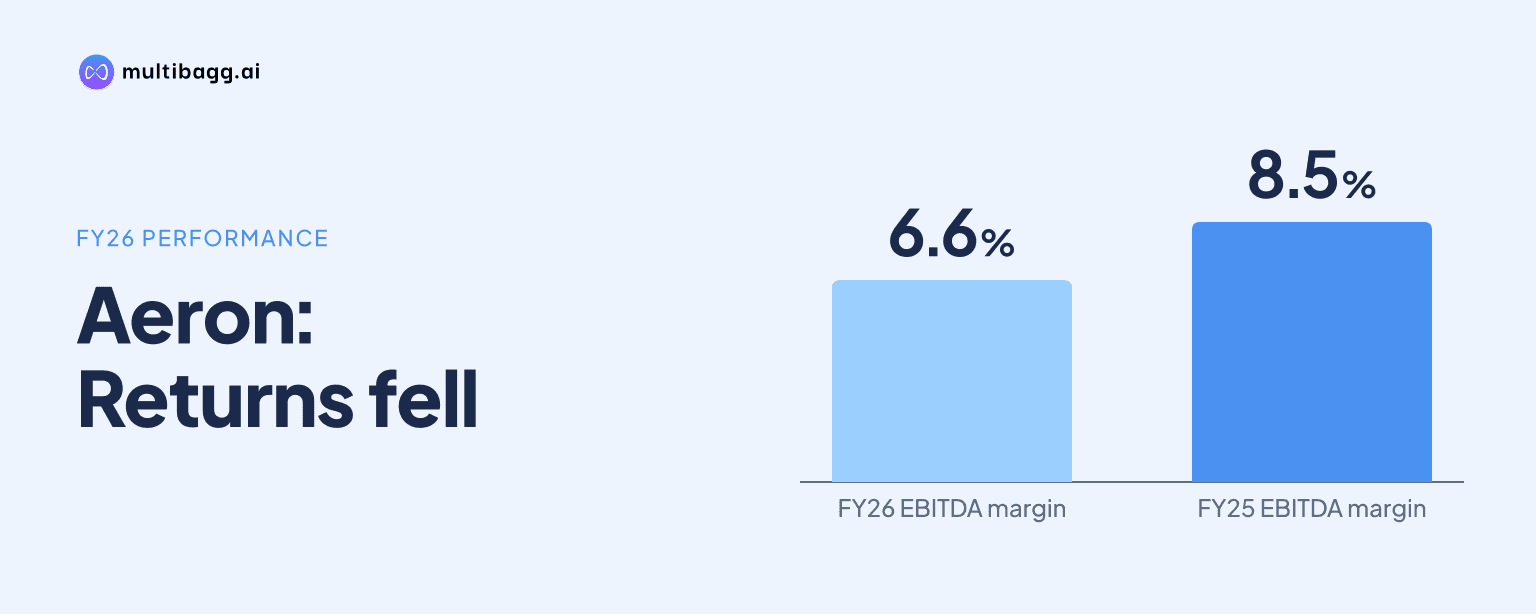
Aeron Composite reported lower FY26 profitability and returns as EBITDA margin declined to 6.6% from 8.5%, profit after tax margin fell to 3.5% from 6.3%, and net debt reached Rs 25.99 crore after net cash of Rs 19 lakh in FY25. Receivable and inventory days also rose to 77 and 96 days, respectively.
Know Aeron Composites inside out
Results, valuation, peers and who's buying, in one view.
Why did Aeron’s FY26 profitability decline?
Aeron’s profitability declined in FY26 despite higher revenue. Total revenue increased to Rs 225 crore from Rs 221 crore in FY25, while EBITDA fell to Rs 14 crore from Rs 18 crore and profit after tax, or PAT, declined to Rs 8 crore from Rs 13 crore in the shareholder-value presentation. The revenue increase was Rs 4 crore, whereas EBITDA declined by Rs 4 crore on this rounded basis.
The margin movement was greater than the revenue change. EBITDA margin fell by 1.9 percentage points to 6.6% in FY26 from 8.5% in FY25, while PAT margin declined by 2.8 percentage points to 3.5% from 6.3%. The detailed profit-and-loss statement reports FY26 EBITDA of Rs 14.4 crore and PAT of Rs 7.6 crore, compared with Rs 18.3 crore and Rs 13.5 crore, respectively, in FY25.
The detailed statement also records higher costs below EBITDA in FY26. Finance costs increased to Rs 3.4 crore from Rs 2.4 crore in FY25, while depreciation and amortisation rose to Rs 6.6 crore from Rs 3.2 crore. Profit before tax before exceptional items therefore declined to Rs 10.8 crore from Rs 18.2 crore before PAT decreased by Rs 5.9 crore year on year.
How did Aeron’s returns on capital change in FY26?
Aeron’s reported return measures fell in FY26. Return on equity, or ROE, declined to 8.4% from 19.7% in FY25, and return on capital employed, or ROCE, decreased to 7.2% from 14.1%. Both FY26 measures were also below FY24, when ROE was 33.2% and ROCE was 32.2%.
The decline followed a reduction already recorded in FY25. ROE fell by 13.5 percentage points in FY25 and a further 11.3 percentage points in FY26, based on the shareholder-value table. ROCE reduced by 18.1 percentage points in FY25 and another 6.9 percentage points in FY26, alongside the decline in FY26 EBITDA and PAT.
Aeron’s net worth nevertheless increased to Rs 110 crore in FY26 from Rs 101 crore in FY25, according to its key performance indicators. PAT fell from Rs 13.5 crore to Rs 7.6 crore over the same period. The presentation does not provide a numerical reconciliation attributing the changes in ROE or ROCE to individual factors.
Got a follow-up? Ask IRIS
Did Aeron’s working-capital cycle lengthen in FY26?
Aeron’s working-capital cycle lengthened in FY26 because receivable and inventory days increased while payable days declined. Receivable days rose to 77 from 75 in FY25, inventory days increased to 96 from 92, and payable days fell to 91 from 95. Together, those movements extended the time represented by the disclosed operating working-capital measures.
An implied operating cycle, calculated as receivable days plus inventory days less payable days, rose to 82 days in FY26 from 72 days in FY25. This is an analysis based on Aeron’s disclosed days rather than a figure reported by Aeron. The same calculation was 61 days in FY24, making the FY26 cycle 21 days longer than two years earlier.
The longer-term change was concentrated in inventory. Inventory days increased by 33 days between FY24 and FY26, compared with a five-day rise in receivable days and a 17-day increase in payable days. Aeron’s FY26 inventory holding of 96 days was the highest level in the FY22 to FY26 series and exceeded FY22’s 81 days.
How much did Aeron’s debt position change in FY26?
Aeron returned to net debt of Rs 25.99 crore in FY26 after reporting net cash of Rs 19 lakh in FY25. Net debt had declined to Rs 6.74 crore in FY24 from Rs 12.04 crore in FY23 before the FY25 net-cash position. The move from FY25 to FY26 was therefore Rs 26.18 crore on the disclosed net-debt measure.
Net debt to EBITDA rose to 1.81 times in FY26 from negative 0.01 times in FY25, reflecting the change from net cash to net debt. The FY26 ratio was higher than FY24’s 0.43 times but below FY22’s 1.95 times. Debt equity also increased to 0.53 times in FY26 from 0.45 times in FY25, while remaining below FY22’s 0.81 times.
The presentation does not quantify capacity-expansion spending, identify the use of additional borrowings, or state that expansion caused the FY26 increase in net debt. It does state that its financial strength supports capacity expansion, while its future-growth framework specifies revenue growth of more than 15% compound annual growth rate, or CAGR, over three years and an EBITDA margin above 10%.
Conclusion
FY26 combined modest revenue growth with lower profitability, reduced reported returns, longer working-capital duration and a return to net debt. Revenue from operations increased by Rs 2.8 crore to Rs 218.1 crore, but EBITDA declined by Rs 3.9 crore and PAT by Rs 5.9 crore, while the implied operating cycle increased by 10 days to 82 days.
The next results will show whether Aeron moves towards management’s stated framework of revenue growth above 15% CAGR over three years and EBITDA margin above 10%. Management has not disclosed a spending figure or borrowing-use breakdown for the FY26 debt increase, leaving the relationship between capacity expansion, funding and working capital unresolved.