










Alkem chronic portfolio grew 22.4%, beat IPM by 640 bps
Key highlights
- Alkem’s chronic portfolio grew 22.4% in Q2 FY27, 640 basis points above IPM growth of 16.0%.
- India sales rose 9.5% year on year to Rs 3,027.5 crore in Q2 FY27 and represented about 68% of sales.
- Alkem launched 26 products in H1 FY27 and had about 14,500 India formulations medical representatives.
- Alkem had 11 brand families above Rs 150 crore in MAT September 2026, up from seven in MAT September 2021.
powered by IRIS
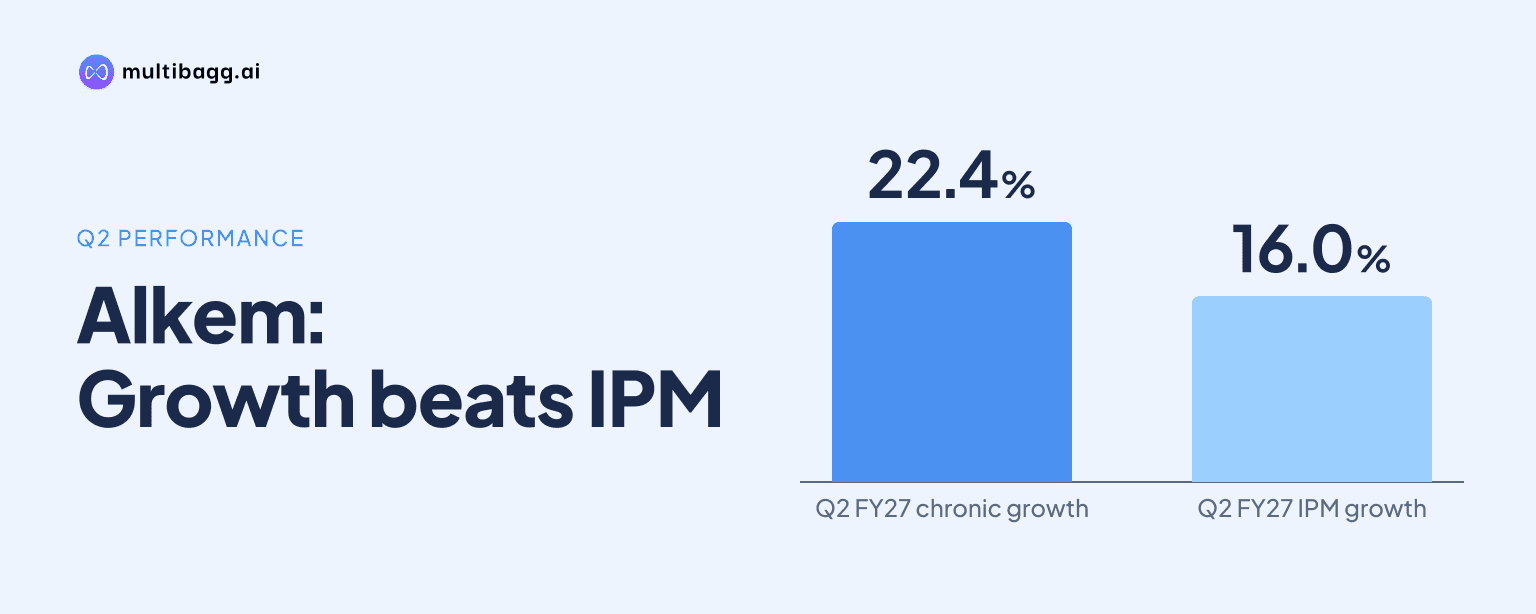
In Q2 FY27, Alkem’s chronic portfolio grew 22.4%, exceeding the Indian pharmaceutical market’s 16.0% rate by 640 basis points. The chronic result contrasted with 12.1% acute growth against 12.3% for the market, while India sales rose 9.5% year on year to Rs 3,027.5 crore.
Know Alkem Laboratories inside out
Results, valuation, peers and who's buying, in one view.
How fast did Alkem’s India business grow in Q2 FY27?
Alkem’s India sales increased 9.5% year on year to Rs 3,027.5 crore in Q2 FY27, from Rs 2,766 crore in Q2 FY26. India represented about 68% of total Q2 FY27 sales of Rs 4,481.5 crore, making it Alkem’s largest regional sales contributor.
India sales rose from Rs 2,216.1 crore in Q2 FY23 to Rs 3,027.5 crore in Q2 FY27. Within the latest quarter, Alkem said branded-business growth was 12.1%, while trade-generics growth was in the mid-single digits, making branded growth faster than the reported 9.5% domestic-sales increase.
Alkem also reported 13.8% value growth in Indian pharmaceutical market, or IPM, data from IQVIA SSA for Q2 FY27, matching IPM growth of 13.8%. This differs from the 9.5% increase in domestic sales reported by Alkem, as the presentation separately identifies the IQVIA SSA value-growth measure.
How did Alkem’s chronic and acute portfolios compare with IPM?
Alkem’s chronic portfolio was its faster-growing domestic stream in Q2 FY27, rising 22.4% versus IPM growth of 16.0%, a difference of 640 basis points. Alkem described chronic growth as 1.4 times the IPM rate using the reported percentage comparison.
Alkem’s acute portfolio grew 12.1% in Q2 FY27, compared with 12.3% for IPM. Acute growth was therefore 20 basis points below the market figure, while chronic growth was 6.4 percentage points above it.
The presentation does not disclose separate sales values or revenue shares for Alkem’s chronic and acute portfolios in Q2 FY27. It does show that the 22.4% chronic growth rate was higher than domestic sales growth of 9.5%, whereas acute growth of 12.1% was close to the 12.3% IPM comparison.
Which therapy areas did Alkem outpace in Q2 FY27?
The displayed therapy table shows Alkem growing faster than IPM in six of eight listed therapy classes in Q2 FY27, led by anti-diabetic growth of 27.2%. Alkem separately stated that it grew faster than IPM in eight key therapies, although the listed rates for anti-infectives and gastrointestinal were below their respective market rates.
The largest gap in the listed data was in pain and analgesics, where Alkem grew 23.9% against IPM growth of 15.4%. Derma also showed a sizeable difference, with Alkem growing 21.6% compared with 13.5% for IPM.
Alkem said it was the leading player by volume in the semaglutide glucagon-like peptide-1, or GLP-1, parenteral market in Q2 FY27. The presentation does not provide a market-share percentage, volume figure or sales value for semaglutide products.
Got a follow-up? Ask IRIS
How is Alkem expanding its domestic brand franchises?
Alkem launched 26 products across multiple therapy areas in H1 FY27 and had an India formulations sales force of about 14,500 medical representatives. The domestic-sales measure includes branded prescriptions, trade generics, biotech and MedTech sales.
As of moving annual total, or MAT, September 2026, Alkem reported 15 brands in the IPM Top 300 and 31 brands among the top three ranks in their covered market, or CVM, for brands above Rs 25 crore. The presentation also identifies PAN as No. 2 and as the biggest brand family in IPM.
Alkem’s number of brand families above Rs 150 crore increased to 11 in MAT September 2026 from seven in MAT September 2021. Families above Rs 50 crore rose to 17 from 13, those above Rs 500 crore rose to two from one, and PAN was the sole disclosed family above Rs 1,500 crore.
How does domestic growth fit within Alkem’s Q2 FY27 performance?
Alkem reported total revenue from operations of Rs 4,552 crore in Q2 FY27, up 13.8% year on year, compared with 9.5% India-sales growth. US sales rose 2.4% to Rs 783 crore, while non-US international sales increased 58% to Rs 671 crore, including Occlutech sales.
Earnings before interest, tax, depreciation and amortisation, or EBITDA, were Rs 1,025.2 crore in Q2 FY27, up 11.3% year on year, with a 22.5% margin. The margin was 50 basis points lower year on year, which management attributed to Enzene contract development and manufacturing operating costs and the Occlutech acquisition.
Reported profit after tax declined 11.7% year on year to Rs 675.3 crore, mainly due to a higher effective tax rate. Alkem also reported net cash of Rs 4,905.4 crore as of September 30, 2026.
Alkem’s Daman formulations facility received an Official Action Indicated, or OAI, classification, and the company said it had submitted a response while remediation remained in progress. Its Mandva active pharmaceutical ingredient facility had a United States Food and Drug Administration inspection with zero observations.
Conclusion
Alkem’s Q2 FY27 domestic data show chronic therapies as the clearest reported source of market outperformance, with 22.4% growth against IPM growth of 16.0%. Acute growth of 12.1% was broadly in line with the 12.3% IPM rate, while India sales rose 9.5% to Rs 3,027.5 crore and represented about 68% of quarterly sales.
The next disclosed matters to watch are remediation progress at Alkem’s Daman formulations facility and the pace of product launches supporting its domestic portfolio. Alkem launched 26 products in H1 FY27, while the presentation does not provide a chronic-sales target, chronic-mix target or a timetable for completing Daman remediation.