










Allied Digital revenue nearly doubled as margins narrowed
Key highlights
- Allied Digital’s consolidated revenue rose from Rs 485 crore in FY22 to Rs 968 crore in FY26.
- EBITDA increased from Rs 70 crore in FY22 to Rs 112 crore in FY26, while margin fell from 14% to 11%.
- PAT margin declined from 8% in FY22 to 4% in FY26.
- Rest of World revenue reached Rs 652 crore, or 73% of FY26 revenue, versus Rs 505 crore, or 63%, in FY25.
powered by IRIS
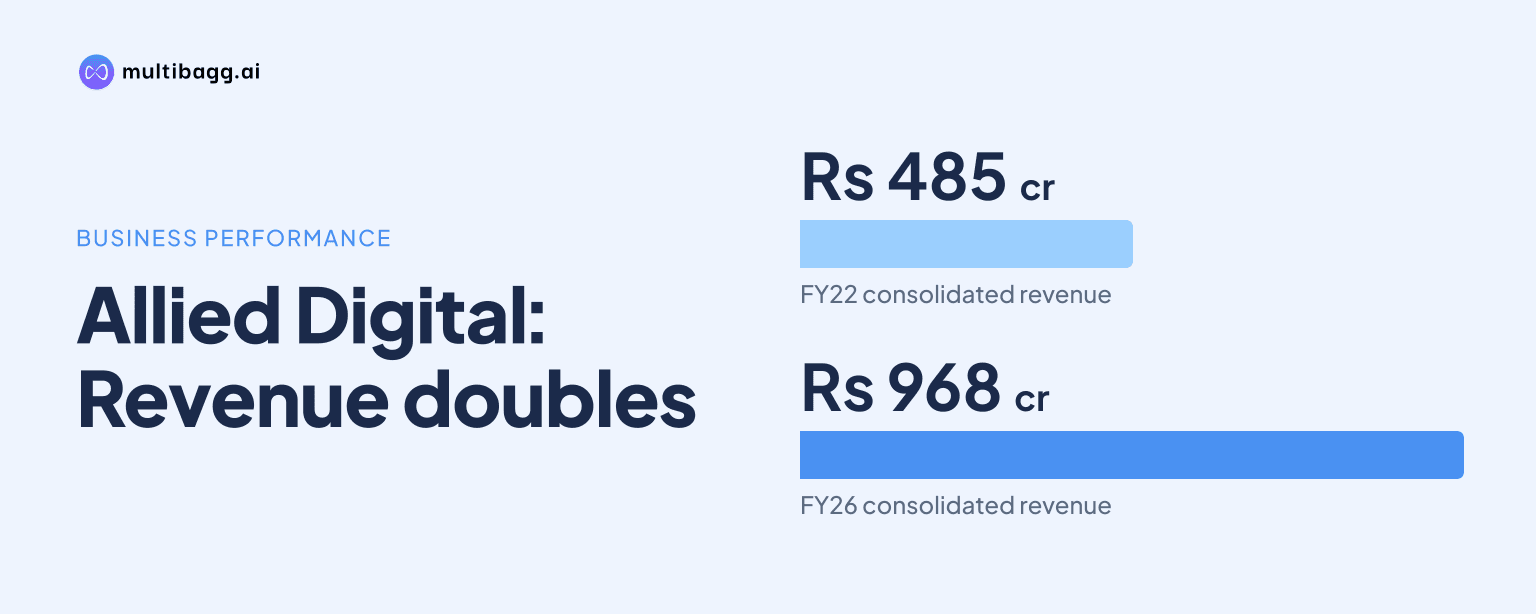
Allied Digital Services Limited increased consolidated revenue by 99.6% from Rs 485 crore in FY22 to Rs 968 crore in FY26, while EBITDA margin declined to 11% from 14% and return on equity returned to 5%. The five-year record shows substantially greater scale, alongside lower operating margin and equity return than at the start of the period.
Know Allied Digital Services inside out
Results, valuation, peers and who's buying, in one view.
How fast did Allied Digital’s revenue grow from FY22 to FY26?
Allied Digital’s consolidated revenue rose by Rs 483 crore over FY22 to FY26, ending at Rs 968 crore, or just under twice the FY22 level of Rs 485 crore. Growth was not even across the five reported financial years: revenue climbed 35% in FY22 and 36% in FY23, slowed to 4% in FY24, and then accelerated to 17% in FY25 and 20% in FY26.
The revenue trend therefore includes a pronounced FY24 pause before two years of renewed expansion. FY23 revenue was Rs 660 crore, up Rs 175 crore from FY22; FY24 added only Rs 27 crore to Rs 687 crore. The additions were larger in the following two years, at Rs 120 crore in FY25 and Rs 161 crore in FY26.
Why did Allied Digital’s profit margins decline despite revenue growth?
Allied Digital’s reported operating margin fell by 3 percentage points, from 14% in FY22 to 11% in FY26, even though EBITDA increased by Rs 42 crore from Rs 70 crore to Rs 112 crore. The presentation supplies the annual revenue, EBITDA and margin figures, but does not specify a cost, pricing or product-mix reason for the margin change.
The pattern was gradual rather than confined to one year. EBITDA margin was 13% in FY23, then 12% in both FY24 and FY25, before reaching 11% in FY26. Absolute EBITDA also dipped from Rs 88 crore in FY23 to Rs 83 crore in FY24, despite revenue increasing from Rs 660 crore to Rs 687 crore; it subsequently rose to Rs 99 crore and Rs 112 crore in FY25 and FY26 respectively.
Profit after tax, or PAT, followed a more variable path. PAT was Rs 37 crore in FY22, Rs 54 crore in FY23, Rs 46 crore in FY24, Rs 32 crore in FY25 and Rs 36 crore in FY26. The corresponding PAT margin moved from 8% in FY22 and FY23 to 7% in FY24 and 4% in both FY25 and FY26. The FY22 and FY23 PAT figures are stated as excluding exceptional income in FY22 and loss from discontinued operations from FY23.
Earnings per share, or EPS, also remained below its FY23 high despite the FY26 revenue increase. EPS rose from Rs 6.67 in FY22 to Rs 9.56 in FY23, declined to Rs 8.07 in FY24 and Rs 4.91 in FY25, and recovered 27% to Rs 6.25 in FY26. That FY26 recovery did not return EPS to either the FY22 or FY23 level.
Got a follow-up? Ask IRIS
How did Allied Digital’s returns and financial ratios change?
Allied Digital’s return on equity, or ROE, returned to 5% in FY26, matching FY22 after reaching 9% in FY23 and 7% in both FY24 and FY25. The FY22 and FY23 ROE measures are presented excluding exceptional income in FY22 and loss from discontinued operations from FY23, consistent with the presentation’s treatment of those periods’ PAT figures.
Return on capital employed, or ROCE, moved differently from ROE. ROCE rose from 9% in FY22 to 13% in FY23, declined to 10% in FY24, and then reached 14% in both FY25 and FY26. Thus, FY26 ROCE was 5 percentage points above its FY22 level, while FY26 ROE was unchanged from FY22 at 5%.
Debt to equity remained within a narrow range of 0.09 times to 0.11 times across the five years. It was 0.10 times in FY22, 0.09 times in FY23, 0.10 times in FY24 and 0.11 times in both FY25 and FY26. Over the same period, the current ratio declined from 4.00 in FY22 to 2.52 in FY26, after recording 4.13 in FY23, 3.58 in FY24 and 3.01 in FY25.
Debtor days show an improvement through FY25 followed by a reversal in FY26. The measure fell from 118 days in FY22 to 84 days in FY23, 81 days in FY24 and 76 days in FY25, before increasing by 20 days to 96 days in FY26. The presentation gives the ratio history but does not provide a reason for the FY26 increase.
Which revenue streams drove Allied Digital’s FY26 expansion?
Allied Digital’s FY26 revenue increase was led by business outside India and by services. Rest of World revenue increased from Rs 505 crore in FY25 to Rs 652 crore in FY26, raising its share from 63% to 73%, while India revenue rose from Rs 302 crore to Rs 316 crore and its share fell from 37% to 27%.
Services remained the larger segment in both periods, accounting for Rs 618 crore, or 77%, of FY25 revenue and Rs 746 crore, or 77%, of FY26 revenue. Solutions represented 23% in each year, with revenue rising from Rs 189 crore to Rs 222 crore. This means the reported FY25-to-FY26 revenue increase of Rs 161 crore was shared by a Rs 128 crore rise in services and a Rs 33 crore rise in solutions.
Enterprise customers supplied the majority of revenue in the customer-profile disclosure. Enterprise revenue rose from Rs 565 crore, or 70%, in FY25 to Rs 741 crore, or 77%, in FY26. Government customer revenue decreased from Rs 242 crore to Rs 227 crore, while total consolidated revenue increased from Rs 807 crore to Rs 968 crore.
The revenue mix comparison shows that the FY26 expansion came with greater reported exposure to Rest of World and enterprise customers. Rest of World revenue added Rs 147 crore, compared with a Rs 14 crore increase in India, and enterprise revenue added Rs 176 crore while government customer revenue declined by Rs 15 crore. The presentation does not state whether these mix movements contributed to the decline in EBITDA margin from 12% in FY25 to 11% in FY26.
Conclusion
Allied Digital recorded a near-doubling of consolidated revenue, from Rs 485 crore in FY22 to Rs 968 crore in FY26, and a Rs 42 crore increase in EBITDA. However, EBITDA margin reduced from 14% to 11%, PAT margin declined from 8% to 4%, and ROE ended FY26 at 5%, the same level as FY22.
The next reported operating markers are management’s H1 FY27 consolidated revenue of Rs 526 crore and Q2 FY27 revenue of Rs 265 crore. Management said it intends to pursue larger, more complex and multi-year engagements, strengthen direct customer relationships and accelerate artificial intelligence adoption in service delivery; subsequent disclosures can show how those plans affect growth, margin and the 96 debtor days reported for FY26.