










Allied Digital revenue nearly doubles but PAT margin halves
Key highlights
- Allied Digital's consolidated revenue rose from Rs 485 crore in FY22 to Rs 968 crore in FY26.
- Allied Digital's EBITDA margin declined from 14% in FY22 to 11% in FY26.
- Allied Digital's PAT margin fell from 8% in FY22 to 4% in FY26, while PAT was Rs 36 crore.
- Allied Digital's debtor days increased to 96 in FY26 from 76 in FY25.
powered by IRIS
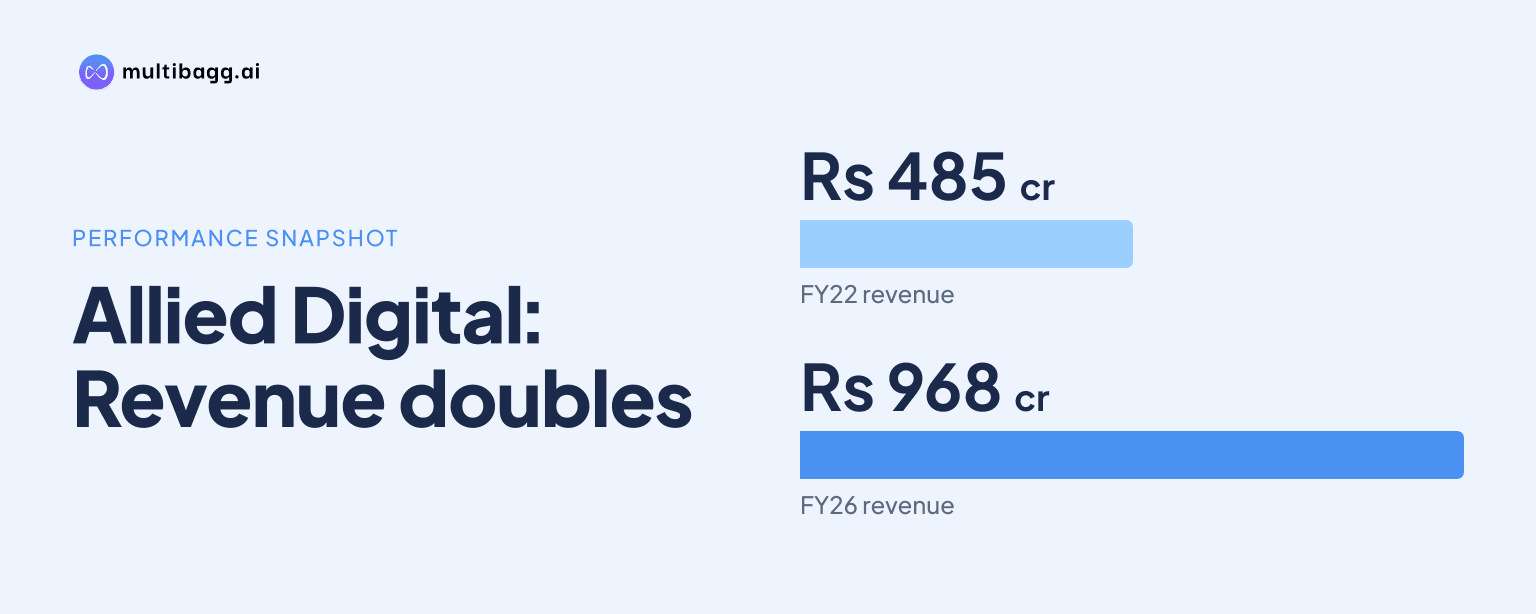
Allied Digital Services Limited nearly doubled consolidated revenue to Rs 968 crore in FY26 from Rs 485 crore in FY22, but profit after tax, or PAT, margin halved to 4% from 8%. Earnings before interest, tax, depreciation and amortisation, or EBITDA, margin also declined by three percentage points to 11% over the period.
Know Allied Digital Services inside out
Results, valuation, peers and who's buying, in one view.
How quickly did Allied Digital's revenue grow from FY22 to FY26?
Allied Digital's consolidated revenue increased by Rs 483 crore between FY22 and FY26, reaching Rs 968 crore after progressing through Rs 660 crore in FY23, Rs 687 crore in FY24 and Rs 807 crore in FY25. The presentation reports annual revenue growth of 35% in FY22, 36% in FY23, 4% in FY24, 17% in FY25 and 20% in FY26.
The growth path was uneven across the five years. Revenue rose by Rs 175 crore from FY22 to FY23, increased by Rs 27 crore in FY24, then added Rs 120 crore in FY25 and Rs 161 crore in FY26. FY23 therefore recorded the largest absolute increase in the presented series, while FY26's 20% growth was below the 36% reported for FY23.
How did Allied Digital's operating and net margins change?
Allied Digital's EBITDA rose to Rs 112 crore in FY26 from Rs 70 crore in FY22, while its EBITDA margin reduced to 11% from 14%. EBITDA reached Rs 88 crore in FY23, fell to Rs 83 crore in FY24, and then increased to Rs 99 crore in FY25 before reaching the FY26 level.
PAT did not follow the same upward path as revenue. PAT rose from Rs 37 crore in FY22 to Rs 54 crore in FY23, then declined to Rs 46 crore in FY24 and Rs 32 crore in FY25 before recovering to Rs 36 crore in FY26. PAT margin was 8% in FY22 and FY23, 7% in FY24, and 4% in both FY25 and FY26.
Earnings per share, or EPS, ended FY26 below its FY23 peak despite the larger revenue base. EPS was Rs 6.67 in FY22, Rs 9.56 in FY23, Rs 8.07 in FY24, Rs 4.91 in FY25 and Rs 6.25 in FY26, when the presentation reported a 27% increase. The presentation flags FY22 and FY23 PAT and EPS figures as exclusive of exceptional income from FY22 and loss from discontinued operations from FY23.
Which revenue streams drove Allied Digital's FY26 expansion?
Allied Digital's FY26 revenue increase was concentrated in Rest of World operations, services and enterprise customers. Rest of World revenue rose to Rs 652 crore in FY26 from Rs 505 crore in FY25, increasing its geographic share to 73% from 63%. India revenue increased to Rs 316 crore from Rs 302 crore, while its share decreased to 27% from 37%.
Services generated Rs 746 crore in FY26, up from Rs 618 crore in FY25, and retained a 77% revenue share in both years. Solutions revenue rose to Rs 222 crore from Rs 189 crore, retaining a 23% share. Enterprise revenue increased to Rs 741 crore from Rs 565 crore, while government-customer revenue declined to Rs 227 crore from Rs 242 crore; the presentation does not disclose margins by geography, segment or customer profile.
Got a follow-up? Ask IRIS
How did Allied Digital's returns, leverage and working-capital indicators move?
Allied Digital reported return on equity, or ROE, of 5% in FY26, equal to FY22 but below 9% in FY23 and 7% in FY24 and FY25. Return on capital employed, or ROCE, was 14% in FY26, compared with 9% in FY22, 13% in FY23 and 10% in FY24. The presentation applies its exceptional-income and discontinued-operations footnote to FY22 and FY23 return figures.
Debt to equity was 0.11 times in FY26, compared with 0.10 times in FY22, 0.09 times in FY23 and 0.10 times in FY24. The current ratio declined from 4.13 in FY23 to 3.58 in FY24, 3.01 in FY25 and 2.52 in FY26. Debtor days improved from 118 in FY22 to 76 in FY25, but increased by 20 days to 96 in FY26 as revenue rose to Rs 968 crore.
What does Allied Digital's FY26 financial pattern show?
Allied Digital's FY26 figures show a larger revenue base alongside lower operating and net margins than in FY22. Revenue rose from Rs 485 crore to Rs 968 crore, while EBITDA increased from Rs 70 crore to Rs 112 crore and PAT moved from Rs 37 crore to Rs 36 crore. EBITDA margin declined from 14% to 11%, while PAT margin moved from 8% to 4%.
The FY26 mix was more weighted toward overseas and enterprise customers than FY25. Rest of World revenue accounted for Rs 652 crore in FY26 against Rs 505 crore in FY25, and enterprise revenue was Rs 741 crore against Rs 565 crore. Services remained 77% of revenue in both years and contributed Rs 746 crore in FY26, but the presentation gives no segment-level explanation for the margin movement.
Conclusion
Allied Digital added Rs 483 crore of consolidated revenue between FY22 and FY26, but the increase did not translate into comparable growth in reported PAT. EBITDA margin fell by three percentage points to 11%, PAT margin declined by four percentage points to 4%, and debtor days rose to 96 from 76 in FY25. ROCE reached 14% in FY26 versus 9% in FY22, while ROE was 5% in both years.
The next point to watch is execution against management's plan to pursue larger, more complex and multi-year engagements and increase artificial-intelligence adoption in service delivery. Management reported consolidated revenue of Rs 265 crore in Q2 FY27 and Rs 526 crore in H1 FY27, with year-on-year growth of 14% and 16%, respectively, while noting that decision cycles for new technology investments had become more extended.