










Anuh Pharma Ltd. H1 profit rises 42% as margins expand 261 bps
Key highlights
- Anuh Pharma Ltd. reported H1 FY27 PAT of Rs. 22.64 crore, up 42.25% year on year.
- Anuh Pharma Ltd.'s H1 FY27 EBITDA margin expanded 261 basis points to 9.74% from 7.13%.
- Anuh Pharma Ltd.'s operating revenue increased 1.80% to Rs. 379.05 crore in H1 FY27.
- Anuh Pharma Ltd.'s domestic revenue rose to Rs. 243 crore while export revenue fell to Rs. 135 crore in H1 FY27.
powered by IRIS
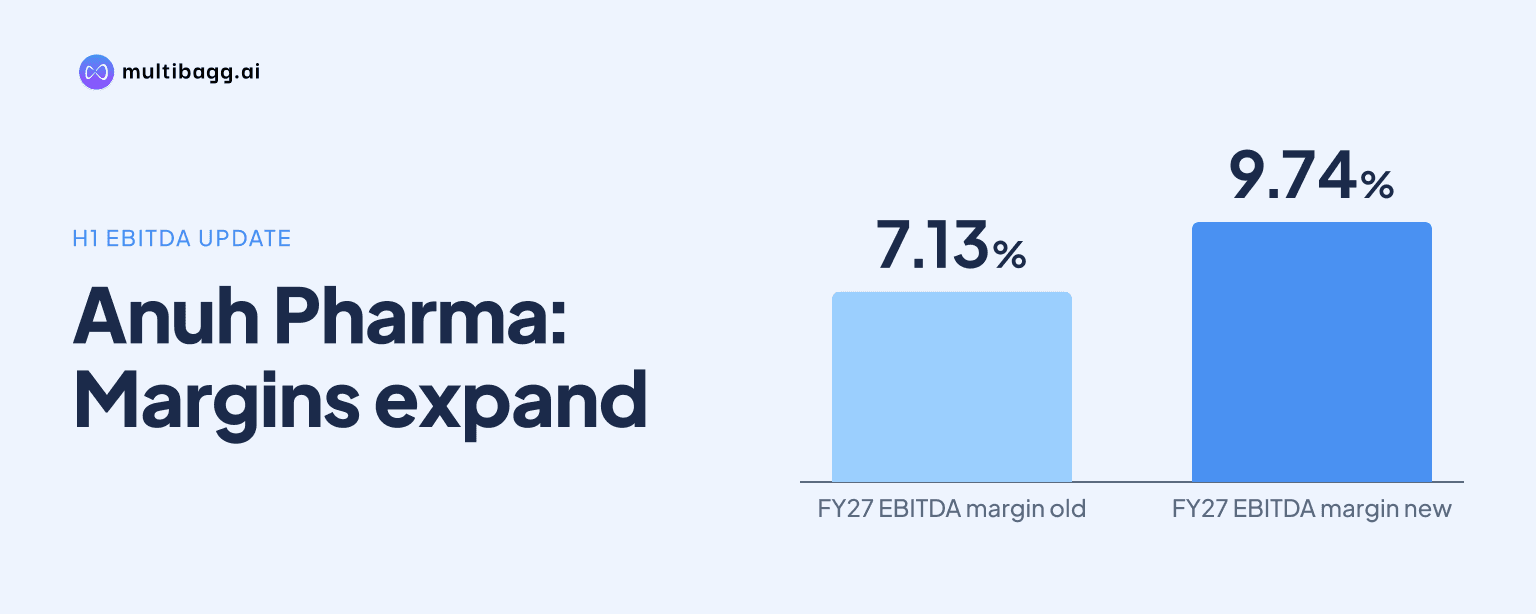
Anuh Pharma Limited reported H1 FY27 profit after tax of Rs. 22.64 crore, up 42.25% year on year, as management said it replaced lower-margin volumes with higher-value products; earnings before interest, tax, depreciation and amortisation (EBITDA) margin rose 261 basis points to 9.74% despite operating revenue increasing only 1.80% to Rs. 379.05 crore.
Know Anuh Pharma inside out
Results, valuation, peers and who's buying, in one view.
How did Anuh Pharma Ltd. increase H1 FY27 profit?
Anuh Pharma Ltd. increased H1 FY27 profit after tax (PAT) by Rs. 6.73 crore to Rs. 22.64 crore from Rs. 15.91 crore in H1 FY26, while revenue added Rs. 6.69 crore to Rs. 379.05 crore. Joint Managing Directors Ritesh Shah and Vivek Shah said Anuh Pharma Ltd. chose margin over volume during the half year, replacing lower-margin volumes with higher-value products.
The improvement was visible across the main profit measures. Operating profit rose 26.23% to Rs. 78.11 crore, EBITDA increased 39.11% to Rs. 36.92 crore, and profit before tax (PBT) climbed 53.19% to Rs. 31.98 crore. The presentation defines operating profit as PBT plus depreciation and other expenses, less other income.
Production rose 15.31% to 987 metric tonnes (MT) in H1 FY27 from 856 MT a year earlier, faster than the 1.80% increase in operating revenue. Management reported both the production increase and the product-mix shift, while reported earnings per share rose 42.06% to Rs. 2.26 from Rs. 1.59.
What changed in Anuh Pharma Ltd.'s margins and costs?
Anuh Pharma Ltd.'s EBITDA margin rose to 9.74% in H1 FY27 from 7.13% in H1 FY26, an expansion of 261 basis points, or 2.61 percentage points. Operating-profit margin increased to 20.61% from 16.62%, PBT margin reached 8.44% from 5.60%, and PAT margin rose to 5.97% from 4.27%.
Interest expense fell to Rs. 0.06 crore in H1 FY27 from Rs. 0.29 crore in H1 FY26, while depreciation decreased to Rs. 4.88 crore from Rs. 5.38 crore. Other income declined 15.61% to Rs. 3.69 crore from Rs. 4.37 crore, so PBT reached Rs. 31.98 crore despite lower other income.
Tax expense rose 88.26% to Rs. 9.34 crore from Rs. 4.96 crore, exceeding the 53.19% increase in PBT. PAT nevertheless increased 42.25%, while return on capital employed (ROCE) was 16.52%, 60 basis points above FY26's 15.92%.
Got a follow-up? Ask IRIS
Which markets supported Anuh Pharma Ltd.'s revenue?
Anuh Pharma Ltd.'s domestic revenue increased to Rs. 243 crore in H1 FY27 from Rs. 196 crore in H1 FY26, while export revenue declined to Rs. 135 crore from Rs. 174 crore. Management said domestic demand offset softer exports, leaving total operating revenue broadly flat at Rs. 379.05 crore.
Domestic revenue increased by Rs. 47 crore, compared with a Rs. 39 crore decline in export revenue in the rounded revenue-mix table. That table reports total revenue of Rs. 378 crore in H1 FY27 and Rs. 371 crore in H1 FY26, while the detailed financial table reports operating revenue of Rs. 379.05 crore and Rs. 372.36 crore respectively.
Customer concentration also changed between the two half years. The top five export customers represented 31% of sales in H1 FY27, down from 46% in H1 FY26, while the top five domestic customers accounted for 33%, up from 27%; across all customers, the top-five share declined to 32% from 36%.
How did Anuh Pharma Ltd. perform in Q2 FY27?
Anuh Pharma Ltd.'s Q2 FY27 operating revenue was Rs. 185.24 crore, down 4.42% from Rs. 193.81 crore in Q1 FY27. EBITDA fell 9.36% sequentially to Rs. 17.55 crore from Rs. 19.36 crore, and PAT declined 1.85% to Rs. 11.21 crore from Rs. 11.42 crore.
The quarterly movement differed by line item. Operating profit increased 4.75% to Rs. 39.96 crore in Q2 from Rs. 38.15 crore in Q1, lifting its margin to 21.57% from 19.68%, while EBITDA margin eased to 9.47% from 9.99%. PBT declined 11.11% to Rs. 15.05 crore, and other income fell to Rs. 0.61 crore from Rs. 3.08 crore.
Q2 accounted for Rs. 185.24 crore of H1 FY27 operating revenue of Rs. 379.05 crore and Rs. 11.21 crore of half-year PAT of Rs. 22.64 crore. Q2 revenue, EBITDA, PBT and PAT were all lower than in Q1, while operating profit was higher.
Conclusion
Anuh Pharma Ltd.'s H1 FY27 results show a gap between sales and earnings growth: operating revenue rose 1.80%, while PAT rose 42.25% and EBITDA margin expanded 261 basis points. Management attributed the difference to a higher-value product mix, alongside domestic revenue of Rs. 243 crore and production of 987 MT as export revenue declined to Rs. 135 crore.
The next issue is whether Anuh Pharma Ltd. can rebuild exports after its Tarapur unit was commissioned with capacity of 2,975 metric tonnes per annum (MTPA). Management identified export rebuilding as the H2 priority and stated an aim to deliver 15% to 20% annual growth, while cautioning that forward-looking statements are based on current expectations and may differ from actual results.