










Arihant diversifies housing as Panvel drives 68% revenue
Key highlights
- Arihant allocates 41% of saleable-area project mix to luxury, 30% to mid-income and 29% to affordable housing.
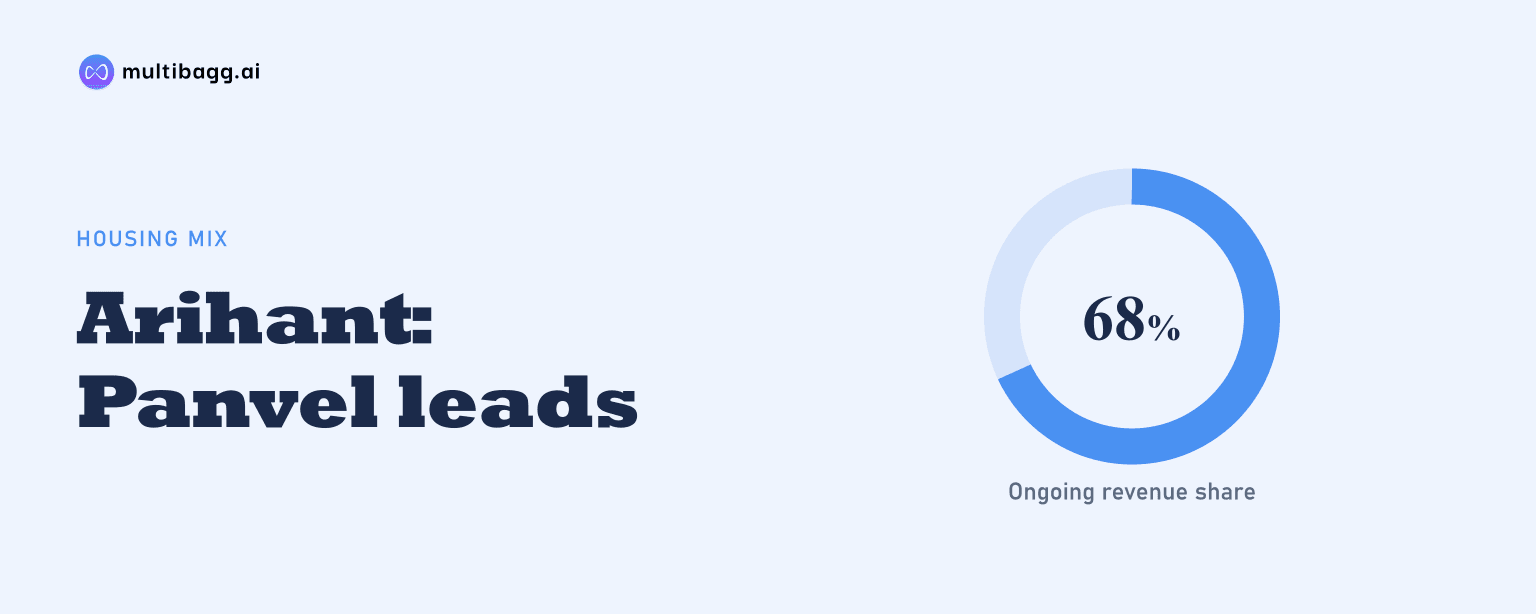
- Panvel’s airport area accounts for 68% of Arihant’s revenue mix from ongoing projects.
- Navi Mumbai’s share of MMR units sold rose from 12% in H1 CY2023 to 17% in H2 CY2025.
- MMR sold 50,153 housing units in H2 CY2025, a year-on-year increase of 3%.
powered by IRIS
Arihant Superstructures Limited is distributing its saleable-area project mix across luxury, mid-income and affordable housing, while Panvel’s airport area contributes 68% of revenue from ongoing projects. Arihant allocates 41% of project mix to luxury housing, 30% to mid-income homes and 29% to affordable housing, alongside 16 projects in the Mumbai Metropolitan Region.
Know Arihant Superstructures inside out
Results, valuation, peers and who's buying, in one view.
How is Arihant divided across housing income segments?
Arihant divides its project mix into 41% luxury housing, 30% mid-income housing and 29% affordable housing, measured by saleable area across all projects. Luxury is the largest individual category, but mid-income and affordable housing together represent 59% of the mix. Arihant describes this approach as “mirroring the population matrix” across income groups.
The 11-percentage-point difference between luxury and affordable housing is narrower than the spread between a luxury-only portfolio and the other disclosed categories. The 1-percentage-point gap between mid-income and affordable housing also indicates nearly equal representation of these two segments. Arihant defines luxury as homes with ticket sizes above Rs 1.5 crore and prices above Rs 10,000 per square foot, compared with affordable homes below Rs 50 lakh and below Rs 5,000 per square foot.
Why does Arihant use a three-segment housing strategy?
Arihant says its three-part mix is intended to reduce exposure to demand stagnation in a downward real-estate cycle and enable faster scale-up in a favourable macroeconomic environment. Management also identifies gaining market share in each income category and micro-market, and aligning supply with the population’s socio-economic spread, as stated advantages of the approach.
The 41% luxury allocation sits alongside 59% allocated to the mid-income Rs 50 lakh-to-Rs 1.5 crore category and the affordable below-Rs-50-lakh category. This gives Arihant projects aimed at affluent buyers, upper-middle-class customers, and middle- and low-income households. The presentation does not disclose bookings, sales or margins separately for the three product categories.
Arihant also lists diversified offerings across income segments among its competitive advantages, together with its geographical focus on the Mumbai Metropolitan Region, or MMR. The strategy therefore combines product segmentation with location selection rather than presenting affordable housing as a separate business line. The 41%, 30% and 29% project-mix figures are based on saleable area, not revenue or the number of homes.
Got a follow-up? Ask IRIS
Where are Arihant’s ongoing-project revenues concentrated?
Arihant reports that Panvel’s airport area contributes 68% of revenue from ongoing projects, making it the largest disclosed geographical exposure. The other 32% is distributed across KDMC-MMR at 10%, Kharghar-Taloja at 8%, Jodhpur and Vashi at 5% each, and Outer MMR at 4%.
The 68% Panvel share is 58 percentage points higher than the next-largest disclosed area, KDMC-MMR, at 10%. It is also larger than the 32% combined contribution from the other five disclosed geographies. Arihant labels the measure as revenue mix of ongoing projects, so it does not establish the revenue mix of completed or future projects.
Arihant describes its portfolio as diversified across 12 micro-markets and reports 16 projects in MMR plus three projects in Jodhpur. Its named MMR locations include Mumbai, Thane, Titwala, Kalyan, Badlapur, Shilphata, Vashi, Taloja, Kharghar, Panvel, Chowk, Karjat and Khopoli. The project counts show the stated geographic footprint, while the 68% figure identifies the current weighting of ongoing-project revenue.
Why is Navi Mumbai gaining share within MMR?
Navi Mumbai’s share of MMR housing units sold rose from 12% in H1 CY2023 to 17% in H2 CY2025, after reaching 18% in H1 CY2025. Arihant links residential demand to employment hubs, infrastructure development and social infrastructure including schools, hospitals, restaurants, sports complexes and shopping malls.
The share was 12% in both halves of CY2023, then increased to 13% in H1 CY2024 and 15% in H2 CY2024. It reached 18% in H1 CY2025 before easing to 17% in H2 CY2025. The latest disclosed reading was therefore 5 percentage points above H2 CY2023, although 1 percentage point below the preceding half-year.
MMR accounted for 28% of units sold among India’s top eight cities in CY2025, the largest disclosed share, ahead of Bangalore at 16%, NCR and Pune at 15% each, Hyderabad at 11%, and Ahmedabad, Chennai and Kolkata at 5% each. In H2 CY2025, MMR sold 50,153 housing units, up 3% year on year, compared with a 10% decline in NCR and a 5% decline in Pune; Bangalore also grew 3% to 28,774 units.
Arihant’s market case cites the Metro line, the Trans-harbor link, proximity to the Mumbai-Pune expressway and Navi Mumbai International Airport, alongside planned Aerocity, CIDCO International Corporate Park, Coastal Road and the Panvel-Karjat railway corridor. The presentation also puts Navi Mumbai’s Air Quality Index at 77, compared with Mumbai at 131 and New Delhi at 300, and identifies it as India’s third-cleanest city for the last three years.
Conclusion
Arihant’s disclosed portfolio combines coverage across three buyer-income groups with a concentrated ongoing-project revenue base. Luxury housing represents 41% of saleable-area mix, while mid-income and affordable housing represent 59% combined; Panvel’s airport area accounts for 68% of ongoing-project revenue. Navi Mumbai’s share of MMR unit sales increased from 12% in H1 CY2023 to 17% in H2 CY2025, supporting the market rationale Arihant presents for its regional emphasis.
What to watch next is whether the 68% Panvel revenue concentration changes as Arihant advances its 16 MMR projects and three Jodhpur projects, and whether Navi Mumbai sustains its sales-share gains after the 18% H1 CY2025 peak. Arihant’s disclosed demand case relies on infrastructure developments including airport connectivity, the Metro line, the Trans-harbor link and the Panvel-Karjat railway corridor, while the presentation does not provide project-level sales timetables or outcomes.