










Arihant Superstructures borrowings reached Rs 903.2 crore in H1 FY27
Key highlights
- ASL reported Rs 903.2 crore of total borrowings in H1 FY27, compared with Rs 331.9 crore in FY23.
- Cash flow from operations was negative in FY23 through FY26, with the largest outflow of Rs 138.8 crore in FY25.
- ASL reported positive operating cash flow of Rs 10.8 crore in H1 FY27.
- Inventories were Rs 892 crore and land was Rs 504.6 crore in H1 FY27.
powered by IRIS
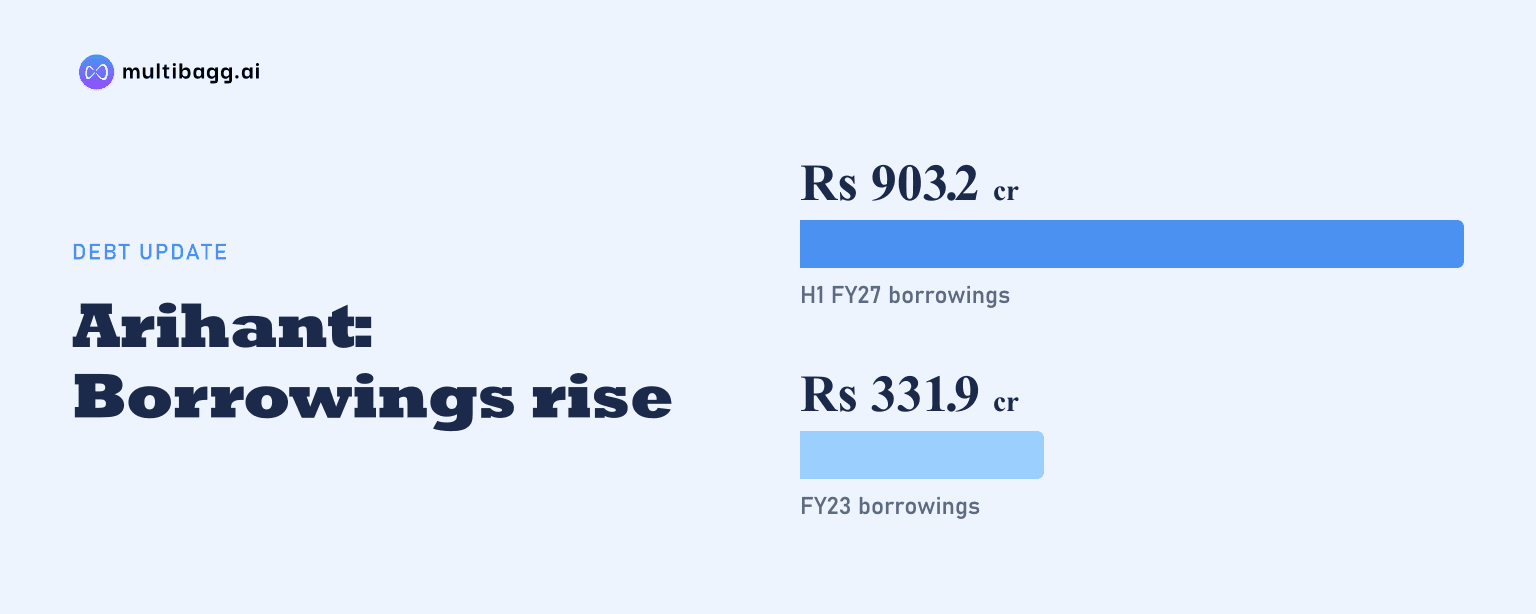
Arihant Superstructures Limited reported Rs 903.2 crore of total borrowings in H1 FY27, up from Rs 331.9 crore in FY23, while cash flow from operations was negative in each full year from FY23 through FY26 before turning positive at Rs 10.8 crore in H1 FY27. The balance sheet also recorded higher inventories, land and equity over the period.
Know Arihant Superstructures inside out
Results, valuation, peers and who's buying, in one view.
How did ASL’s borrowings change through H1 FY27?
ASL’s total borrowings reached Rs 903.2 crore in H1 FY27, comprising Rs 795.4 crore of non-current borrowings and Rs 107.8 crore of current borrowings. That was Rs 30.3 crore above the Rs 872.9 crore reported at FY26 and Rs 571.3 crore above the Rs 331.9 crore reported at FY23. Non-current borrowings increased by Rs 36.8 crore from FY26, while current borrowings declined by Rs 7.5 crore.
The sharpest annual rise occurred in FY25, when total borrowings increased to Rs 738.3 crore from Rs 477.4 crore in FY24. Borrowings had risen from Rs 331.9 crore in FY23 to Rs 477.4 crore in FY24, then reached Rs 872.9 crore in FY26. The historical financial-performance page separately reports FY26 debt of Rs 872.9 crore, matching the combined current and non-current borrowings in the consolidated balance sheet.
ASL reported a Rs 22.2 crore cash and bank balance in H1 FY27, compared with Rs 20.1 crore at FY26. Its cash-flow statement showed closing cash and cash equivalents of Rs 17.3 crore in H1 FY27, compared with Rs 14.5 crore in FY26. The presentation reports both measures but does not explain the difference between the balance-sheet cash and bank balance and closing cash and cash equivalents.
What changed on ASL’s balance sheet as borrowings rose?
ASL’s total assets increased to Rs 1,804.9 crore in H1 FY27 from Rs 981.2 crore in FY23, an increase of Rs 823.7 crore over the same period as borrowings rose by Rs 571.3 crore. Current assets grew to Rs 1,651.9 crore from Rs 919.2 crore, while non-current assets rose to Rs 153 crore from Rs 62 crore. The presentation does not assign a specific use to the additional borrowings.
Inventories were Rs 892 crore in H1 FY27, compared with Rs 483.8 crore in FY23, although they were marginally lower than Rs 898 crore at FY26. Land rose to Rs 504.6 crore from Rs 293.2 crore in FY23. Property, plant and equipment increased from Rs 10.3 crore in FY23 to Rs 117.3 crore in H1 FY27, including a Rs 109.9 crore balance at FY26.
Trade receivables declined to Rs 87.6 crore in H1 FY27 from Rs 100.4 crore in FY26, but remained above Rs 85.2 crore in FY23. Total equity rose to Rs 469.9 crore from Rs 245.6 crore across FY23 to H1 FY27, while other equity increased from Rs 168.6 crore to Rs 336.4 crore. Non-controlling interest also increased from Rs 35.8 crore to Rs 90.2 crore.
Got a follow-up? Ask IRIS
Why did ASL report negative operating cash flow for four financial years?
ASL reported negative cash flow from operations in FY23, FY24, FY25 and FY26, but the presentation does not provide a working-capital reconciliation or a stated cause for these outflows. The outflow widened from Rs 11.8 crore in FY23 to Rs 120.7 crore in FY24 and Rs 138.8 crore in FY25, before narrowing to Rs 70.8 crore in FY26.
The cash-flow record differed from the reported income statement. ASL generated profit after tax of Rs 42.7 crore in FY23, Rs 69.2 crore in FY24, Rs 54.7 crore in FY25 and Rs 46 crore in FY26, despite operating cash outflows in all four years. Operating revenue increased from Rs 398.4 crore in FY23 to Rs 551 crore in FY26, while earnings before interest, tax, depreciation and amortisation, or EBITDA, increased from Rs 77.5 crore to Rs 126.6 crore.
Financing cash flow was positive in each of the four full years shown, at Rs 6.9 crore in FY23, Rs 128.4 crore in FY24, Rs 218.6 crore in FY25 and Rs 94.5 crore in FY26. Investing cash flow was negative in all four years, including Rs 76.6 crore in FY25 and Rs 27.4 crore in FY26. These reported cash-flow lines show financing inflows during years of operating and investing outflows, without identifying the use of each financing inflow.
Did ASL’s cash generation and earnings change in H1 FY27?
ASL reported positive cash flow from operations of Rs 10.8 crore in H1 FY27, reversing the Rs 70.8 crore outflow in FY26. It was the only positive operating-cash-flow figure among the five periods displayed in the cash-flow statement. H1 FY27 is a half-year period, however, whereas FY26 is a full year, so the two periods are not equivalent comparisons.
H1 FY27 included an investing cash outflow of Rs 6.6 crore and a financing cash outflow of Rs 1.4 crore. Closing cash and cash equivalents consequently rose by Rs 2.8 crore from Rs 14.5 crore at FY26 to Rs 17.3 crore in H1 FY27. The reported financing outflow contrasts with the financing inflows recorded in FY23 through FY26.
ASL recorded Rs 264.8 crore of operating revenue, Rs 55.5 crore of EBITDA and Rs 20.3 crore of profit after tax in H1 FY27. Interest expense was Rs 30.4 crore, compared with Rs 67.7 crore for the full FY26. The presentation provides no H1 FY26 income-statement figures, so it does not permit a year-on-year comparison for the H1 FY27 revenue, EBITDA or profit measures.
Across FY23 to FY26, interest expense increased from Rs 25.6 crore to Rs 67.7 crore as borrowings rose from Rs 331.9 crore to Rs 872.9 crore. Profit after tax peaked at Rs 69.2 crore in FY24 before declining to Rs 46 crore in FY26. The profit-after-tax margin fell from 13.57% in FY24 to 8.35% in FY26, while the EBITDA margin increased from 22.19% to 22.98% over the same comparison.
Conclusion
ASL’s reported borrowings nearly tripled from Rs 331.9 crore in FY23 to Rs 903.2 crore in H1 FY27, alongside asset growth led by inventories and land. Four full years of negative operating cash flow occurred despite positive reported profit after tax, while financing cash flow was positive in every year from FY23 through FY26. H1 FY27 produced a Rs 10.8 crore operating cash inflow and a Rs 2.8 crore increase in closing cash and cash equivalents.
The next disclosed operational marker is progress on approximately 5,855 units under execution. ASL delivered 1,721 units in FY26, compared with 344 in FY25, and says Phase 1 of larger projects reached the delivery stage in FY26. Management says remaining phases will reach delivery stages at regular intervals; subsequent disclosures can show whether those deliveries coincide with continued operating cash generation, inventory movement and changes in borrowings.