










ASM operating cash flow turned negative as receivables doubled
Key highlights
- ASM reported negative Rs 30.6 crore of net operating cash flow for the half year ended September 2026, versus positive Rs 50 crore a year earlier.
- Trade receivables increased Rs 131.7 crore to Rs 247.4 crore at September 2026 from Rs 115.7 crore at March 2026.
- Inventories rose Rs 41.4 crore to Rs 111.0 crore, while the cash-flow statement recorded a Rs 129.5 crore working-capital outflow.
- H1 FY27 profit before tax rose 83% to Rs 87.3 crore and revenue from operations increased 68% to Rs 467.2 crore.
powered by IRIS
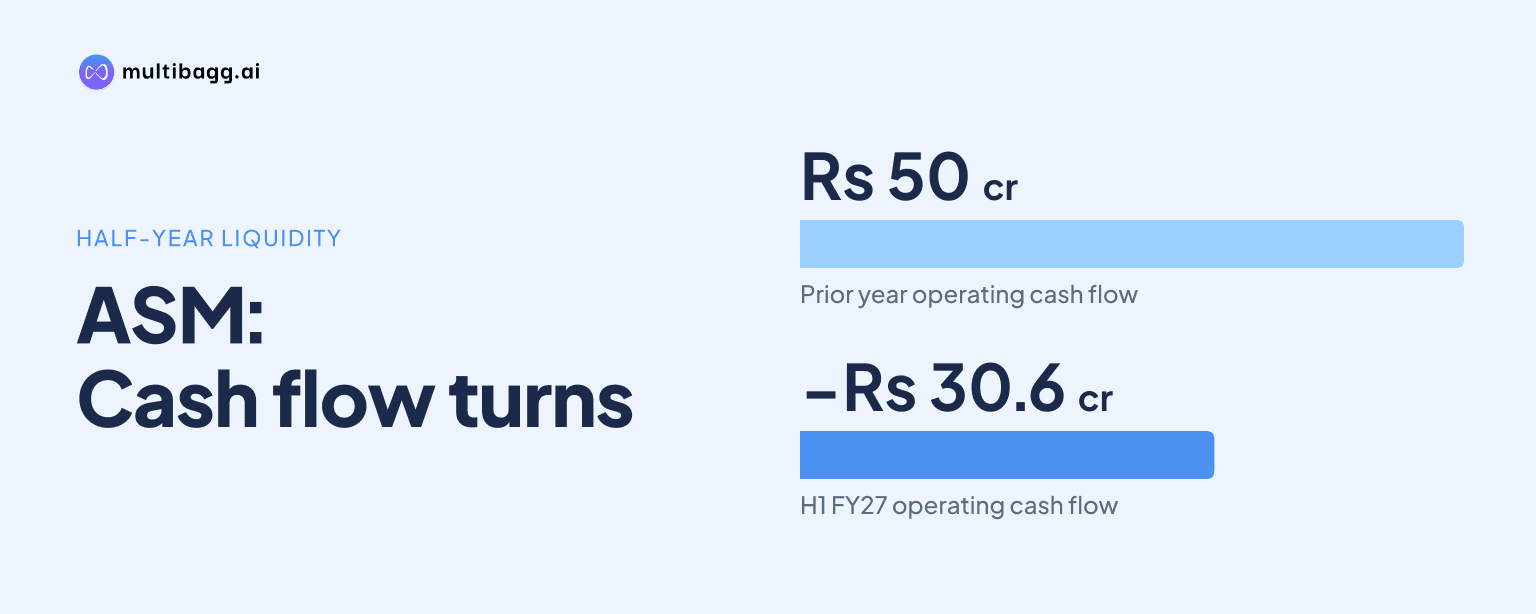
ASM Technologies reported net cash used in operating activities of Rs 30.6 crore for the half year ended September 2026, versus an inflow of Rs 50 crore a year earlier, as trade receivables rose to Rs 247.4 crore from Rs 115.7 crore even while profit before tax increased 83% to Rs 87.3 crore.
Know ASM Technologies inside out
Results, valuation, peers and who's buying, in one view.
Why did ASM’s operating cash flow turn negative in H1 FY27?
ASM’s operating cash flow turned negative because a Rs 129.5 crore working-capital outflow more than offset Rs 105.4 crore of operating profit before working-capital changes in the half year ended September 2026. Cash generated from operations consequently moved to an outflow of Rs 24.1 crore, compared with an inflow of Rs 61.8 crore in the corresponding September 2025 period. After Rs 6.6 crore of net direct taxes paid, net cash from operating activities was negative Rs 30.6 crore.
The reversal was substantial against the prior period, when working-capital changes contributed Rs 5.2 crore rather than consuming cash. Operating profit before working-capital changes rose Rs 48.8 crore, from Rs 56.6 crore in September 2025 to Rs 105.4 crore in September 2026, but the working-capital swing was Rs 134.7 crore. This means higher reported operating profit was not converted into operating cash during H1 FY27.
Which balance-sheet items absorbed ASM’s cash?
ASM’s trade receivables increased Rs 131.7 crore between March 2026 and September 2026, reaching Rs 247.4 crore from Rs 115.7 crore, while inventories increased Rs 41.4 crore to Rs 111.0 crore from Rs 69.6 crore. These two current-asset movements occurred in the same six-month period in which the cash-flow statement recorded a Rs 129.5 crore working-capital outflow. The presentation does not split that cash-flow line by individual balance-sheet item.
Receivables became the largest reported current-asset category at Rs 247.4 crore at September 2026, ahead of inventories at Rs 111.0 crore and cash and cash equivalents at Rs 23.4 crore. Current assets rose Rs 138.0 crore to Rs 436.1 crore, while current liabilities rose Rs 110.6 crore to Rs 224.8 crore. The rise in current liabilities included current borrowings of Rs 112.1 crore, up from Rs 43.9 crore, and trade payables of Rs 35.5 crore, up from Rs 28.0 crore.
The asset build was not limited to working capital. Non-current assets increased Rs 81.2 crore to Rs 286.0 crore, with goodwill rising Rs 68.4 crore to Rs 80.6 crore and property, plant and equipment increasing Rs 11.0 crore to Rs 104.0 crore. Total assets therefore increased Rs 219.2 crore from Rs 502.9 crore at March 2026 to Rs 722.1 crore at September 2026, alongside the expansion in receivables and inventory.
Got a follow-up? Ask IRIS
Did ASM’s profit growth continue despite the cash outflow?
ASM’s reported profitability continued to rise in H1 FY27, with revenue from operations increasing 68% to Rs 467.2 crore and profit before tax increasing 83% to Rs 87.3 crore. Earnings before interest, tax, depreciation and amortisation, or EBITDA, increased 87% to Rs 105.2 crore. The EBITDA margin rose to 22.5% from 20.3%, while the profit-before-tax margin increased to 18.7% from 17.2%.
Profit after tax attributable after non-controlling interest was Rs 57.5 crore in H1 FY27, compared with Rs 34.7 crore in H1 FY26, an increase of 66%. Profit after tax before non-controlling interest rose 77% to Rs 61.3 crore. The distinction matters because the September 2026 balance sheet reported Rs 44.6 crore of non-controlling interest, compared with nil at March 2026, and the H1 income statement recorded Rs 3.8 crore of non-controlling interest.
ASM’s revenue mix in H1 FY27 was led by Design-Led Manufacturing, or DLM, at 74.3%, with Engineering Research and Development, or ER&D, contributing 25.7%. Domestic revenue represented 76.4% and exports 23.6%. In Q2 FY27 alone, revenue was Rs 268.4 crore, up 74% year on year, while DLM represented 74.8% of segment mix, showing that the manufacturing-led business remained the larger contributor through the first half.
How did ASM finance its balance-sheet expansion?
ASM reported Rs 44.8 crore of net cash from financing activities for the half year ended September 2026, compared with Rs 52.8 crore in the prior-year period. Current borrowings rose Rs 68.2 crore during the period to Rs 112.1 crore, and non-current borrowings rose Rs 12.9 crore to Rs 81.6 crore. Total equity increased to Rs 353.5 crore from Rs 307.0 crore, including other equity of Rs 338.9 crore.
Net cash from investing activities was an inflow of Rs 3.0 crore in September 2026, versus an outflow of Rs 101.6 crore in September 2025. Despite negative operating cash flow, cash and cash equivalents ended the period at Rs 23.4 crore, compared with Rs 6.3 crore at the beginning. The cash-flow statement labels a Rs 17.1 crore net decrease in cash and cash equivalents, although its stated opening and closing cash figures increase by Rs 17.1 crore; the presentation does not explain this apparent sign inconsistency.
Management said in October that ASM completed a Rs 526 crore preferential issue. According to management, the proceeds are to be used for new manufacturing capacity, strategic acquisitions and investments, debt reduction and working capital. This event was disclosed after the September 2026 balance-sheet date, so the presentation does not show its effect in the September closing cash balance of Rs 23.4 crore.
Conclusion
ASM’s H1 FY27 figures show a divergence between reported earnings and cash conversion: EBITDA rose 87% to Rs 105.2 crore and profit before tax rose 83% to Rs 87.3 crore, while working-capital changes consumed Rs 129.5 crore. The balance-sheet movements in receivables, inventory, borrowings and current liabilities show the scale of cash requirements accompanying the expansion in revenue to Rs 467.2 crore.
The next point to watch is how the Rs 526 crore October preferential issue is deployed across capacity, acquisitions, debt reduction and working capital, as management described. Management also cited memoranda of understanding with Karnataka and Tamil Nadu and approval under the Electronics Component Manufacturing Scheme as part of a plan to expand DLM beyond seven facilities, making subsequent disclosures on receivables, inventories and borrowings relevant as those plans progress.