










ASM Technologies Q2 revenue rose 74%, EBITDA margin reached 22%
Key highlights
- ASM reported Q2 FY27 revenue from operations of Rs 268.4 crore, up 74% year on year.
- ASM’s Q2 FY27 EBITDA rose 94% to Rs 59.0 crore and EBITDA margin increased to 22.0% from 19.7%.
- ASM’s Q2 FY27 PAT increased 60% to Rs 30.7 crore, while PAT margin declined to 11.4% from 12.4%.
- ASM reported negative Rs 30.6 crore of operating cash flow for the period ended September 2026, versus positive Rs 50 crore a year earlier.
powered by IRIS
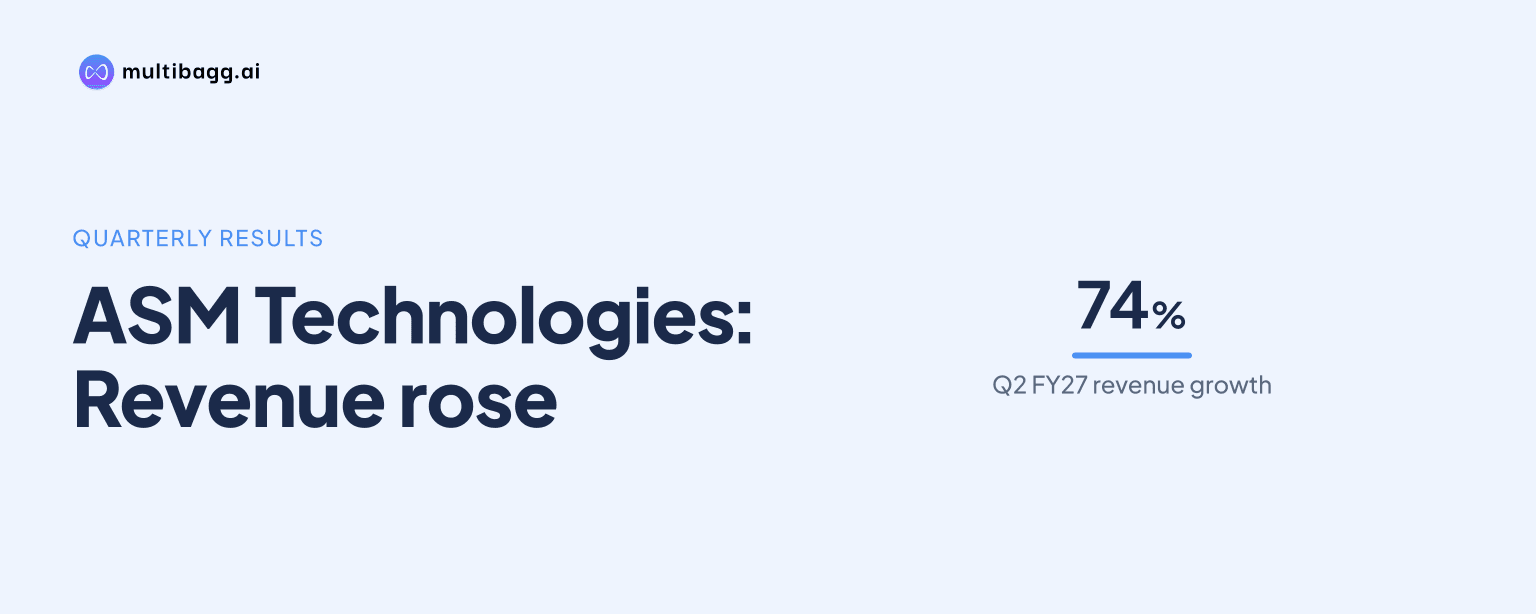
ASM Technologies reported consolidated revenue from operations of Rs 268.4 crore in Q2 FY27, up 74% year on year, while earnings before interest, tax, depreciation and amortisation (EBITDA) margin rose to 22.0% from 19.7%. Profit after tax (PAT) increased 60% to Rs 30.7 crore, although its margin fell to 11.4% from 12.4%.
Know ASM Technologies inside out
Results, valuation, peers and who's buying, in one view.
How did ASM’s Q2 FY27 revenue and EBITDA change?
ASM’s Q2 FY27 revenue from operations increased by Rs 113.9 crore to Rs 268.4 crore from Rs 154.5 crore in Q2 FY26, a reported 74% rise. EBITDA increased by Rs 28.5 crore to Rs 59.0 crore from Rs 30.5 crore, representing 94% year-on-year growth, while the EBITDA margin expanded by 2.3 percentage points to 22.0%.
ASM’s operating profit rose faster than revenue in Q2 FY27, with EBITDA growth of 94% exceeding the 74% revenue increase. Earnings before interest and tax (EBIT) rose 90% to Rs 54.3 crore from Rs 28.6 crore, and the EBIT margin increased to 20.2% from 18.5%, showing that margin expansion was reported at both EBITDA and EBIT levels.
What changed in ASM’s Q2 FY27 cost base?
ASM’s Q2 FY27 EBITDA margin expanded because the Rs 113.9 crore increase in revenue exceeded the combined Rs 85.2 crore increase in cost of goods sold, employee cost and other expenses. Cost of goods sold rose by Rs 58.7 crore to Rs 111.0 crore, employee cost increased by Rs 18.2 crore to Rs 70.8 crore, and other expenses rose by Rs 8.3 crore to Rs 27.5 crore.
The consolidated statement reported no exceptional-item gain or loss in either Q2 FY27 or Q2 FY26. Depreciation increased to Rs 5.4 crore from Rs 3.2 crore, but EBIT still rose by Rs 25.7 crore to Rs 54.3 crore; other income declined to Rs 0.6 crore from Rs 1.3 crore over the same comparison.
Why did ASM’s Q2 PAT margin decline despite profit growth?
ASM’s PAT margin declined by 1.0 percentage point to 11.4% in Q2 FY27 from 12.4% in Q2 FY26, despite PAT rising by Rs 11.6 crore to Rs 30.7 crore. This differed from the EBITDA-margin increase to 22.0% from 19.7% and the profit-before-tax margin increase to 18.0% from 17.1%.
Finance cost rose to Rs 5.6 crore in Q2 FY27 from Rs 2.1 crore a year earlier, while tax increased to Rs 13.8 crore from Rs 7.2 crore. PAT before non-controlling interest was Rs 34.5 crore, up 80% from Rs 19.1 crore, but ASM recorded Rs 3.8 crore of non-controlling interest in Q2 FY27, compared with no such deduction in Q2 FY26.
Got a follow-up? Ask IRIS
Which ASM businesses and geographies made up Q2 FY27 revenue?
ASM’s Design-Led Manufacturing (DLM) business represented 74.8% of Q2 FY27 revenue, while Engineering Research and Development (ER&D) represented 25.2%. Management said both DLM and ER&D contributed to the quarter’s performance, but the presentation does not disclose separate revenue amounts, margins or growth rates for either business.
Domestic business accounted for 68.4% of Q2 FY27 revenue and exports represented 31.6%. For H1 FY27, domestic revenue represented 76.4% and exports 23.6%, making the export share 8.0 percentage points higher in the quarter than in the first-half mix; DLM’s 74.8% quarterly share was close to its 74.3% H1 FY27 share.
What do ASM’s H1 FY27 results and cash movements show?
ASM reported H1 FY27 revenue from operations of Rs 467.2 crore, up 68% from Rs 277.4 crore in H1 FY26, while EBITDA increased 87% to Rs 105.2 crore from Rs 56.2 crore. The H1 EBITDA margin increased to 22.5% from 20.3%, while PAT rose 66% to Rs 57.5 crore and PAT margin edged down to 12.3% from 12.5%.
For the period ended September 2026, ASM reported net cash from operating activities of negative Rs 30.6 crore, compared with positive Rs 50 crore for the period ended September 2025. The cash-flow statement recorded a negative Rs 129.5 crore change in working capital, versus a positive Rs 5.2 crore change a year earlier, despite operating profit before working-capital changes rising to Rs 105.4 crore from Rs 56.6 crore.
At September 2026, trade receivables stood at Rs 247.4 crore, compared with Rs 115.7 crore at March 2026, while inventories rose to Rs 111.0 crore from Rs 69.6 crore. Cash and cash equivalents increased to Rs 23.4 crore from Rs 6.3 crore, while current borrowings rose to Rs 112.1 crore from Rs 43.9 crore and non-current borrowings increased to Rs 81.6 crore from Rs 68.7 crore.
Conclusion
ASM’s Q2 FY27 results combined 74% revenue growth with a 2.3-percentage-point increase in EBITDA margin, lifting EBITDA by 94% to Rs 59.0 crore. The H1 FY27 figures showed the same broad pattern, with revenue up 68% to Rs 467.2 crore and EBITDA margin at 22.5%, while PAT margins declined in both the quarter and first half and operating cash flow turned negative for the period ended September 2026.
The next disclosed developments are management’s planned use of Rs 526 crore raised through a preferential issue completed in October for new manufacturing capacity, strategic acquisitions and investments, debt reduction and working capital. Management also cited memoranda of understanding with Karnataka and Tamil Nadu, approval under the Electronics Component Manufacturing Scheme, and a plan to expand DLM beyond its current seven facilities; it did not disclose the order-book or enquiry-pipeline value cited for the second half.