










Augmont Enterprises Q2 PAT rises 6.8% as revenue falls 27%
Key highlights
- Augmont Enterprises reported Q2 FY27 consolidated profit after tax of ₹1,203.03 million, up 6.8% year on year.
- Revenue from operations declined 27.0% year on year to ₹158,355.12 million in Q2 FY27.
- Purchases of stock in trade fell by ₹46,855.65 million year on year to ₹109,071.60 million.
- Finance costs rose to ₹180.87 million in Q2 FY27 from ₹4.09 million a year earlier.
powered by IRIS
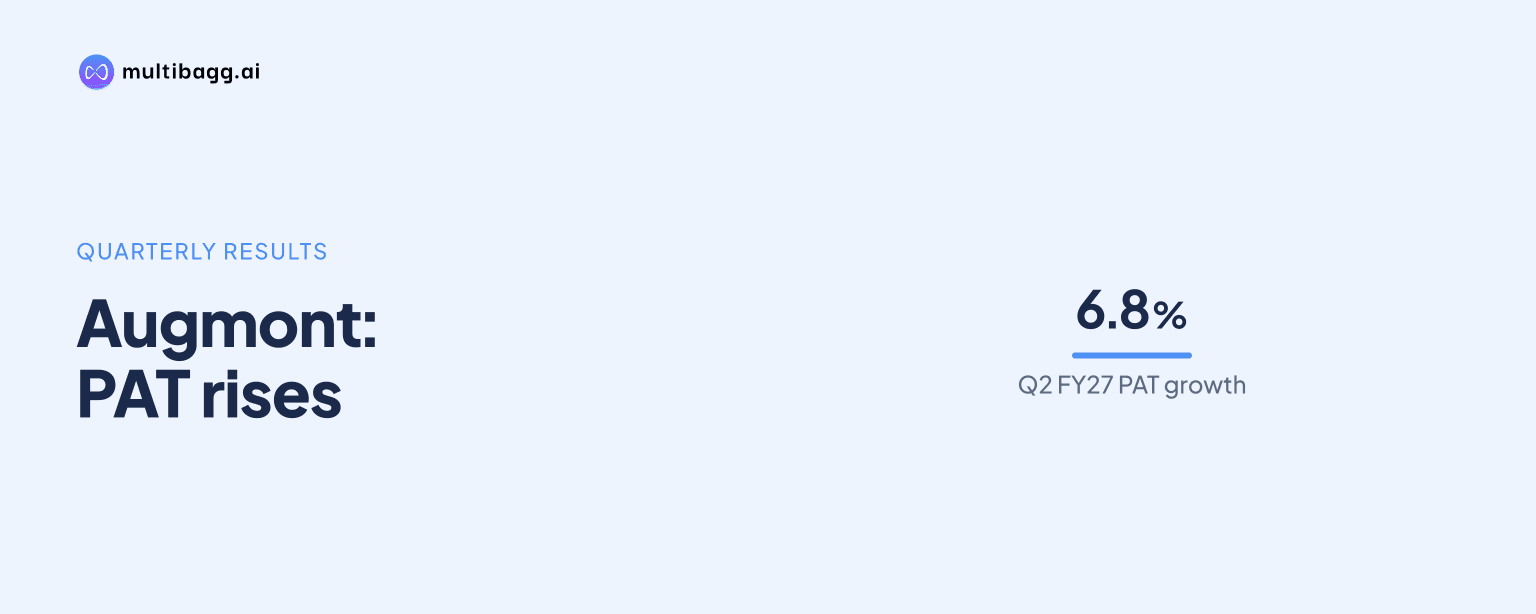
Augmont Enterprises Limited reported consolidated profit after tax of ₹1,203.03 million for Q2 FY27, up 6.8% year on year, even as revenue from operations declined 27.0% to ₹158,355.12 million for the quarter ended September 30, 2026.
Know Augmont Enterprises inside out
Results, valuation, peers and who's buying, in one view.
What did Augmont Enterprises report for Q2 FY27?
Augmont Enterprises said its Board of Directors approved the unaudited standalone and consolidated financial results for the quarter and half-year ended September 30, 2026, at its November 4, 2026 meeting. The detailed Q2 comparison in the supplied results information reports consolidated profit after tax of ₹1,203.03 million, compared with ₹1,126.62 million in Q2 FY26.
Revenue from operations was ₹158,355.12 million in Q2 FY27, against ₹216,922.27 million a year earlier. This represents a 27.0% year-on-year reduction in the reported top line, while profit after tax rose by 6.8% over the same comparison period.
The supplied material contains differing standalone and consolidated labels in certain summary passages. One summary identifies ₹846.37 million as standalone quarterly profit, while another reverses the standalone and consolidated labels. The detailed year-on-year comparison, however, identifies ₹1,203.03 million as consolidated profit after tax. Investors should refer to the company’s filed financial statements for the final line-item classification.
Why did profit increase while revenue declined?
The reported expense figures show that material costs and purchases of stock in trade declined alongside revenue during the quarter. Cost of materials consumed fell to ₹47,191.48 million in Q2 FY27 from ₹61,729.21 million in Q2 FY26, while purchases of stock in trade declined to ₹109,071.60 million from ₹155,927.25 million.
The reductions in these two expense lines were larger in absolute terms than the revenue contraction. The supplied results commentary links this cost movement to the rise in profit before tax despite the lower revenue base. It also notes that changes in gold trading and manufacturing sales volumes or pricing may have affected revenue, but does not provide a quantified operational split for those factors.
Finance costs moved in the opposite direction. They increased to ₹180.87 million from ₹4.09 million in the year-earlier quarter. The available information does not provide a formal management explanation for this increase, although it remains a relevant item for assessing the company’s future earnings and working-capital requirements.
Got a follow-up? Ask IRIS
How does Q2 compare with Augmont Enterprises' recent performance?
Augmont Enterprises had reported revenue of ₹189,460 million for the quarter ended June 30, 2026, based on the figures supplied for Q1 FY27. Net profit for that quarter was reported at ₹610 million, down 15.3% from ₹720 million in the corresponding quarter a year earlier.
The Q2 result therefore presents a different combination of revenue and profit trends. Revenue in the September quarter was below the June-quarter figure in the supplied data, whereas consolidated profit after tax of ₹1,203.03 million was higher than the Q1 net profit figure. The data points are drawn from separate reported summaries and should be read with the distinction between consolidated and standalone disclosures in mind.
For FY26, the supplied information states that Augmont Enterprises recorded profit of ₹3,480 million. It also includes historical sales figures that point to substantial growth in bullion transaction values over preceding financial years. However, the quarterly data illustrate that higher sales values do not automatically translate into proportionately higher margins or net profit.
What does the result mean for investors and operations?
The Q2 numbers place attention on the relationship between revenue, procurement costs and financing expenses. A 27.0% reduction in revenue combined with higher profit indicates that the cost structure changed materially during the quarter. For investors, this makes the composition of revenue and expenses as important as the profit growth headline.
Augmont Enterprises operates in bullion-linked businesses where transaction values can be influenced by metal prices, trading volumes and inventory activity. The provided results do not disclose segment-level revenue, margins, volumes or a detailed explanation of the revenue decline. As a result, the available financial release supports an assessment of reported outcomes but not firm conclusions on the underlying operational drivers.
The company has scheduled a virtual earnings conference call for November 5, 2026, at 5:00 PM IST to discuss its Q2 and first-half FY27 financial results. Management representatives and the EY investor relations team are expected to participate. The call may provide clarification on revenue movement, cost trends, finance costs and the classification differences visible in the supplied summaries.
Conclusion
Augmont Enterprises delivered higher reported consolidated Q2 profit despite a sharp decline in revenue from operations. Lower material consumption and stock-in-trade purchases accompanied the improvement in profit, while finance costs increased substantially from the year-earlier quarter. The results underline the importance of tracking margins and cost movement rather than revenue alone.
The next disclosed event is the November 5, 2026 earnings call. Investors will watch for management commentary on the 27.0% revenue decline, the rise in finance costs, the durability of the cost trends, and clarification of the standalone and consolidated profit figures in the company’s financial disclosures.