










Bata cuts inventory 26% as stock turns rise to 2.6 in Q2’27
Key highlights
- Bata’s indexed inventory declined 26% from X in Q2’24 to 0.74X in Q2’27.
- Bata’s stock turns rose from 1.9 in Q2’24 to 2.6 in Q2’27.
- Bata’s full-price sales increased from 77% in Q2’26 to 86% in Q2’27.
- Bata reported store clutter at 0.71X and availability at 1.33X in Q2’27.
powered by IRIS
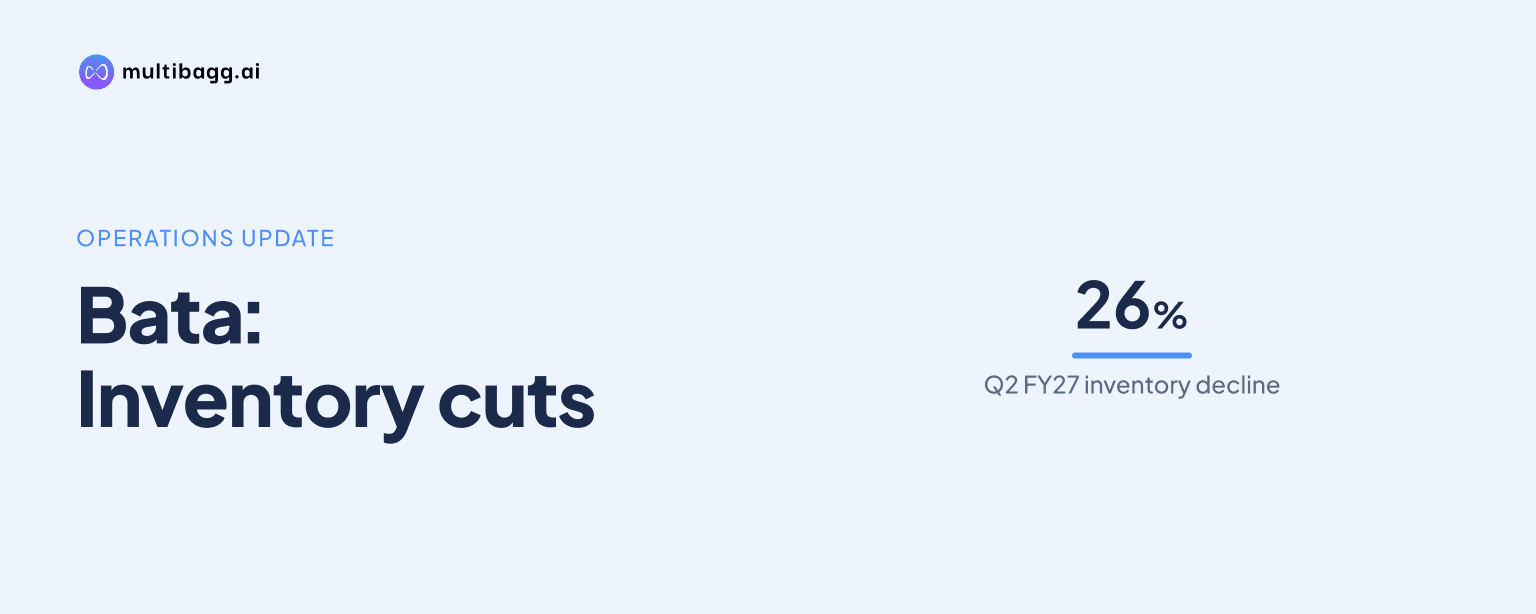
Bata cut its indexed inventory by 26% between Q2’24 and Q2’27, while stock turns rose from 1.9 to 2.6 and full-price sales increased to 86% from 77%. The Q2’27 presentation also reported improved product freshness and availability, alongside lower clutter at stores.
Know Bata India inside out
Results, valuation, peers and who's buying, in one view.
How much did Bata reduce inventory?
Bata reduced inventory by 26% from Q2’24 to Q2’27, with the presentation’s indexed inventory measure falling from X in Q2’24 to 0.74X in Q2’27. The reduction was gradual across the disclosed periods: the index was 0.91X in Q2’25 and 0.80X in Q2’26 before reaching 0.74X. This means the Q2’27 level was lower than each of the three prior Q2 reference points shown.
Bata labels the measure “Inventory (INR Mn)” but provides indexed values rather than absolute rupee inventory amounts. The 26% reduction therefore establishes the direction and scale of change relative to the Q2’24 base, but the presentation does not disclose the inventory balance in rupees. Bata describes the programme as progress in inventory agility and says efficiencies covered both quantity and quality.
How did Bata’s stock turns change?
Bata’s stock turns reached 2.6 in Q2’27, up from 2.2 in Q2’26 and 1.9 in both Q2’24 and Q2’25. The progression shows no change between Q2’24 and Q2’25, followed by a 0.3 increase in Q2’26 and a further 0.4 increase in Q2’27. The Q2’27 level was therefore 0.7 turns above the Q2’24 and Q2’25 readings.
Bata characterises the Q2’27 year-on-year turns improvement as about 21%. The displayed values move from 2.2 in Q2’26 to 2.6 in Q2’27, while the presentation does not specify the turnover or average-inventory calculation used for that approximate percentage. The disclosed figures link a lower inventory index of 0.74X in Q2’27 with the highest stock-turn figure in the four-period series.
Did Bata improve inventory freshness and full-price sales?
Bata reported a freshness index of 1.12X in Q2’27, compared with X in Q2’25 and 1.08X in Q2’26, while full-price sales reached 86%. Freshness is defined in the presentation as “6 months,” although the material does not provide a more detailed definition of the index. The Q2’27 reading was 12% above the Q2’25 indexed base and 0.04X above the Q2’26 level.
Full-price sales held at 77% in Q2’25 and Q2’26 before rising to 86% in Q2’27. That is a 9-percentage-point increase from both earlier periods. Bata’s presentation places this measure beside freshness, stock turns and the inventory index as indicators of inventory agility, but it does not disclose the sales value, units sold, markdown rate or product-category mix behind the 86% result.
The timing of the two measures differed. Freshness moved from X in Q2’25 to 1.08X in Q2’26, whereas full-price sales remained at 77% in those two periods. In Q2’27, freshness reached 1.12X and full-price sales rose to 86%, so the reported increase in full-price selling occurred in the latest period shown.
Got a follow-up? Ask IRIS
How did Bata improve store availability and decluttering?
Bata reported that overall availability improved by 18% and showed an indexed availability level of 1.33X in Q2’27 against X in Q2’26. The presentation treats availability as a separate store metric from the inventory index on the following page. It also identifies improved demand planning as the operating mechanism disclosed alongside the inventory-efficiency measures.
Store clutter declined to 0.71X in Q2’27 from X in Q2’25, after registering 0.75X in Q2’26. Thus, the indexed clutter measure declined by 0.04X between Q2’26 and Q2’27. The availability chart lists 1.33X for Q2’27 while separately stating that availability improved by 18%; the presentation does not explain the baseline or calculation behind that percentage.
The store measures provide context for the inventory figures rather than an absolute stock count. Lower clutter at 0.71X and availability at 1.33X were both reported for Q2’27, when the inventory index was 0.74X, turns were 2.6 and full-price sales were 86%. Bata does not quantify how much of the availability movement came from demand planning, replenishment, assortment changes or another action.
What does Bata’s inventory trend show across the reported periods?
Bata’s reported trend is a reduction in indexed inventory from X to 0.74X over Q2’24 to Q2’27, alongside turns rising from 1.9 to 2.6 and full-price sales increasing from 77% to 86% between Q2’26 and Q2’27. The comparison matters because the stock reduction was accompanied by higher reported availability, rather than a disclosed fall in availability. The presentation identifies inventory quantity and quality as the two areas where efficiencies continued to progress.
The latest period contains the clearest combination of disclosed changes: Q2’27 had the lowest inventory index in the series, the highest turns, the highest freshness index and the highest full-price sales share. However, the source supplies indices and percentages rather than absolute inventory, sales or gross-margin figures. It therefore supports an assessment of operational movement across the displayed periods, not a calculation of the financial value created by the changes.
Conclusion
Bata’s Q2’27 presentation shows inventory at 0.74X of the Q2’24 indexed base, a 26% reduction, while turns reached 2.6 from 1.9 and full-price sales rose by 9 percentage points to 86%. Freshness reached 1.12X, store clutter fell to 0.71X and the company reported an 18% improvement in availability, presenting lower stock alongside changed store and sales metrics.
The next point to watch after Q2’27 is whether Bata’s disclosed improved demand planning is reflected in later inventory, turns, freshness, full-price sales and availability updates. The presentation gives no absolute inventory amount, sales value, markdown rate or quantitative inventory target, so comparable future disclosures would be needed to establish whether the Q2’27 measures are sustained.