










Blue Water Logistics H1 revenue rose 249% as operating cash fell
Key highlights
- BWL's H1 FY27 revenue increased 249.5% to Rs 483.29 crore.
- BWL's Sep-26 operating cash flow was negative Rs 106.17 crore after a Rs 158.32 crore working-capital outflow.
- BWL's trade receivables rose to Rs 223.59 crore at Sep-26 from Rs 141.43 crore at Mar-26.
- BWL's combined current and non-current borrowings were Rs 330.83 crore at Sep-26.
powered by IRIS
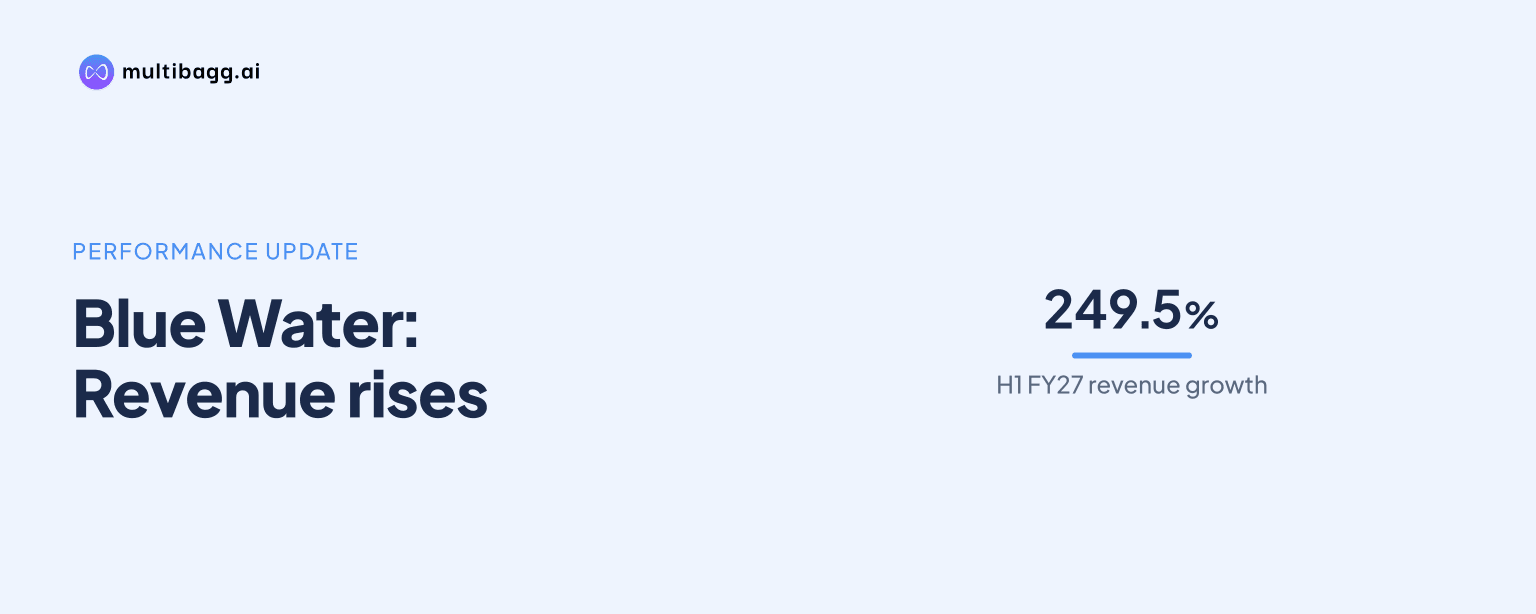
Blue Water Logistics reported H1 FY27 revenue of Rs 483.29 crore, up 249.5% year on year, while its Sep-26 cash-flow statement showed negative net cash from operating activities of Rs 106.17 crore after a Rs 158.32 crore working-capital outflow. Earnings before interest, tax, depreciation and amortisation (EBITDA) rose 278.4% to Rs 59.03 crore, and profit after tax (PAT) rose 247.4% to Rs 29.97 crore.
Know Blue Water Logistics inside out
Results, valuation, peers and who's buying, in one view.
How fast did BWL's revenue and profit grow in H1 FY27?
BWL's revenue and profit increased sharply in H1 FY27, with revenue rising 249.5%, EBITDA increasing 278.4% and PAT growing 247.4% from H1 FY26. Revenue from operations reached Rs 483.29 crore, compared with Rs 138.27 crore a year earlier, while EBITDA rose to Rs 59.03 crore from Rs 15.60 crore and PAT increased to Rs 29.97 crore from Rs 8.63 crore.
EBITDA expanded faster than revenue, lifting the H1 EBITDA margin to 12.2% from 11.3%, an increase of 90 basis points. One hundred basis points equal one percentage point. PAT margin was unchanged at 6.2% in both H1 FY27 and H1 FY26, despite the larger absolute profit.
BWL also reported sequential growth in Q2 FY27. Revenue was Rs 272.07 crore, up 28.8% from Rs 211.22 crore in Q1 FY27, and EBITDA rose 50.3% to Rs 35.44 crore. Q2 PAT increased 14.5% to Rs 16.00 crore, but PAT margin declined to 5.9% from 6.6% in Q1 FY27.
Why was BWL's operating cash flow negative?
BWL's Sep-26 net cash from operating activities was negative Rs 106.17 crore because a Rs 158.32 crore working-capital outflow exceeded Rs 59.34 crore of operating profit before working-capital changes. That pre-working-capital amount comprised Rs 40.21 crore of profit before tax and Rs 19.13 crore of adjustments for non-operating items. Cash generated or used from operations was negative Rs 98.98 crore before direct taxes paid of Rs 7.19 crore.
The working-capital outflow in the Sep-26 column was substantially larger than the negative Rs 31.71 crore shown in the Mar-26 column. Net cash from operating activities also widened from a negative Rs 17.73 crore in the Mar-26 column. The presentation does not provide a line-by-line cash-flow bridge identifying the individual movements in receivables, loans and advances, or other current assets.
Balance-sheet movements provide context but do not establish the exact causes of the cash-flow change. Trade receivables increased to Rs 223.59 crore at Sep-26 from Rs 141.43 crore at Mar-26, while short-term loans and advances rose to Rs 33.68 crore from Rs 9.08 crore. Other current assets increased to Rs 75.10 crore from Rs 29.93 crore over the same dates.
How did BWL fund its cash outflows by Sep-26?
BWL's Sep-26 cash-flow statement shows financing inflow of Rs 213.77 crore, which partly funded negative operating cash flow of Rs 106.17 crore and investing outflow of Rs 112.14 crore. The result was a net decrease in cash and cash equivalents of Rs 4.55 crore in the Sep-26 column, compared with a Rs 22.80 lakh increase in the Mar-26 column.
Borrowings rose across both balance-sheet categories. Non-current borrowings were Rs 104.02 crore at Sep-26, compared with Rs 25.08 crore at Mar-26, while current borrowings increased to Rs 226.81 crore from Rs 82.45 crore. Combined borrowings were therefore Rs 330.83 crore at Sep-26, against Rs 107.53 crore at Mar-26.
Total equity rose to Rs 111.07 crore at Sep-26 from Rs 81.10 crore at Mar-26, as reserves and surplus increased to Rs 100.07 crore from Rs 70.10 crore. Equity share capital was unchanged at Rs 11 crore. The historical financial table reports debt-to-equity of 3.0 in H1 FY27, compared with 1.3 in FY26, while H1 finance cost rose to Rs 9.53 crore from Rs 1.48 crore a year earlier.
Got a follow-up? Ask IRIS
What changed in BWL's revenue mix and margins?
BWL's H1 FY27 revenue mix shifted toward air freight, whose share rose to 20.3% from 13.0% in FY26. Air-freight revenue was Rs 98.04 crore in H1 FY27. Ocean freight remained the largest segment at Rs 328.02 crore, accounting for 67.9% of total revenue, though its share declined from 70.0% in FY26 and 83.0% in FY25.
Non-vessel-operating common carrier, or NVOCC, revenue contributed Rs 39.75 crore, or 8.2%, in H1 FY27, compared with 8.0% of revenue in FY26. Surface freight and railway freight generated Rs 14.73 crore and represented 3.0% of H1 FY27 revenue, down from a 6.0% share in FY26. Custom house clearance contributed Rs 2.77 crore, or 0.6%, compared with Rs 11.58 crore and 3.0% in FY26.
The mix change accompanied an EBITDA-margin increase to 12.2% in H1 FY27 from 11.4% in FY26. PAT margin, however, was 6.2% in H1 FY27, below the 6.5% reported for FY26. The presentation does not attribute the margin movements to individual segments, pricing, freight rates, or costs.
How did BWL's asset base change by Sep-26?
BWL's total assets rose to Rs 485.90 crore at Sep-26 from Rs 235.50 crore at Mar-26. Current assets were Rs 358.31 crore, compared with Rs 196.12 crore, led by the Rs 82.16 crore increase in trade receivables. Cash and cash equivalents stood at Rs 25.94 crore at Sep-26, compared with Rs 15.68 crore at Mar-26.
Non-current assets increased to Rs 127.59 crore from Rs 39.38 crore. Tangible assets were Rs 96.77 crore at Sep-26, compared with Rs 21.56 crore at Mar-26, while other non-current assets increased to Rs 24.84 crore from Rs 5.02 crore. Capital work in progress of Rs 6.55 crore shown at Mar-26 was not shown in the Sep-26 column.
Conclusion
BWL's H1 FY27 results combine rapid reported growth with cash conversion pressure. Revenue increased 249.5% to Rs 483.29 crore, EBITDA margin rose by 90 basis points to 12.2%, and PAT climbed to Rs 29.97 crore. Yet the Sep-26 cash-flow statement recorded negative operating cash flow of Rs 106.17 crore because the Rs 158.32 crore working-capital outflow exceeded profit generated before working-capital changes.
What remains unresolved in the presentation is the detailed composition of the working-capital outflow and the use of the Rs 213.77 crore financing inflow. Future disclosures on receivables of Rs 223.59 crore, short-term loans and advances of Rs 33.68 crore, other current assets of Rs 75.10 crore, and combined borrowings of Rs 330.83 crore would clarify whether operating cash conversion changes alongside revenue growth.