










Blue Water Logistics Limited margin reaches 12.2% in H1 FY27
Key highlights
- BWL's EBITDA margin increased from 3.9% in FY23 to 12.2% in H1 FY27.
- BWL reported H1 FY27 revenue of Rs 483.293 crore and EBITDA of Rs 59.029 crore.
- BWL's debt-to-equity ratio rose to 3.0 times in H1 FY27 from 1.3 times in FY26.
- Air Freight represented 20.3% of H1 FY27 revenue, up from 1.1% in FY25.
powered by IRIS
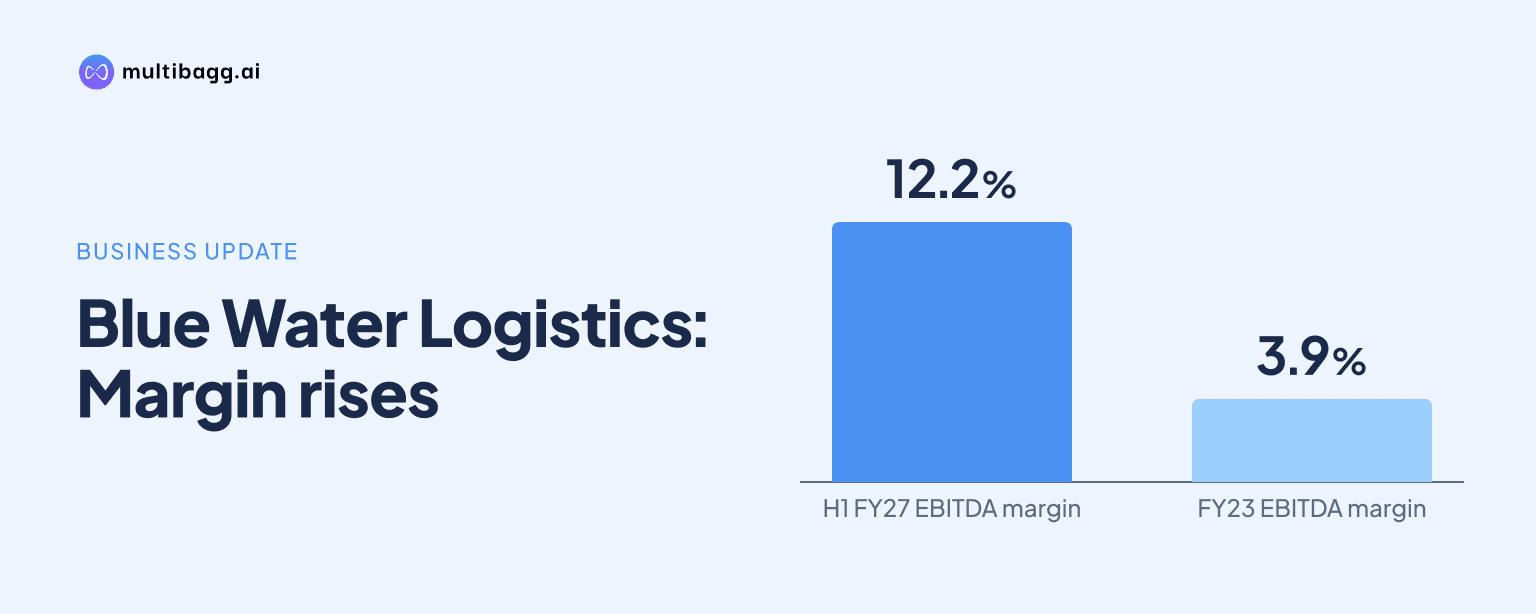
Blue Water Logistics Limited reached an earnings before interest, tax, depreciation and amortisation (EBITDA) margin of 12.2% in H1 FY27, up from 3.9% in FY23, with EBITDA of Rs 59.029 crore on revenue of Rs 483.293 crore; debt-to-equity concurrently rose to 3.0 times from 1.3 times in FY26.
Know Blue Water Logistics inside out
Results, valuation, peers and who's buying, in one view.
How did BWL's EBITDA margin change?
BWL's EBITDA margin rose by 8.3 percentage points from 3.9% in FY23 to 12.2% in H1 FY27. The reported margin increased in every intervening period, reaching 7.6% in FY24, 9.6% in FY25 and 11.4% in FY26, before the 12.2% H1 FY27 result.
EBITDA increased from Rs 3.83 crore in FY23 to Rs 10.5 crore in FY24, Rs 18.8 crore in FY25 and Rs 43.973 crore in FY26. In H1 FY27, EBITDA was Rs 59.029 crore, exceeding the FY26 full-year figure by Rs 15.056 crore, although H1 FY27 and FY26 cover different lengths of time.
Revenue rose from Rs 97.982 crore in FY23 to Rs 386.021 crore in FY26, then reached Rs 483.293 crore in H1 FY27. The presentation reports the revenue and margin progression but does not identify the pricing, cost or operating factors that produced the expansion in EBITDA margin.
What happened to BWL's net profit margin?
BWL's profit after tax (PAT) margin rose from 1.6% in FY23 to 6.5% in FY26, then decreased to 6.2% in H1 FY27. PAT itself increased from Rs 1.541 crore in FY23 to Rs 5.94 crore in FY24, Rs 10.671 crore in FY25 and Rs 25.207 crore in FY26.
H1 FY27 PAT was Rs 29.972 crore, Rs 4.765 crore above the full-year FY26 amount, but the two periods are not directly comparable because H1 FY27 is a partial-year period. The presentation records a 0.3-percentage-point decline in PAT margin from FY26 even as EBITDA margin improved by 0.8 percentage points.
The gap between BWL's EBITDA margin and PAT margin widened to 6.0 percentage points in H1 FY27, from 4.9 percentage points in FY26. EBITDA margin was 12.2% and PAT margin was 6.2% in H1 FY27, while the FY26 measures were 11.4% and 6.5%, respectively; the presentation does not provide a breakdown for the difference.
How did BWL's leverage and returns move?
BWL's debt-to-equity ratio declined from 5.3 times in FY23 to 1.8 times in FY24 and FY25, then to 1.3 times in FY26. It increased to 3.0 times in H1 FY27, a rise of 1.7 times from the FY26 level.
The supplied presentation does not disclose the debt and equity balances behind the H1 FY27 ratio. It therefore does not establish whether the increase to 3.0 times resulted from higher borrowings, a change in equity, or both.
Return on equity (ROE) was 62.4% in H1 FY27, compared with 49.8% in FY26 and 35.0% in FY23. Return on capital employed (ROCE) was 22.5% in H1 FY27, versus 20.4% in FY26 and 14.3% in FY23; both ratios were higher in FY24, when ROE was 91.2% and ROCE was 36.0%.
Got a follow-up? Ask IRIS
Which BWL segments drove H1 FY27 revenue?
BWL's Ocean Freight business remained the largest contributor in H1 FY27, generating Rs 328.016 crore, or 67.9% of total revenue. Its share declined from 83.0% in FY25 and 70.0% in FY26, despite Ocean Freight revenue rising from Rs 270.214 crore in FY26.
Air Freight was the second-largest H1 FY27 business, contributing Rs 98.038 crore, or 20.3% of revenue. Its share increased from 1.1% in FY25 and 13.0% in FY26, while revenue increased from Rs 50.183 crore in FY26 to Rs 98.038 crore in H1 FY27.
Non-vessel operating common carrier (NVOCC) revenue was Rs 39.745 crore, or 8.2% of H1 FY27 revenue, compared with Rs 30.882 crore and 8.0% in FY26. Surface Freight and Railway Freight contributed Rs 14.729 crore, or 3.0%, while Custom House Clearance generated Rs 2.765 crore, or 0.6%; the presentation does not disclose segment-level margins.
What does BWL's Sep-26 cash flow show?
BWL reported net cash used in operating activities of Rs 106.173 crore in the Sep-26 column, despite profit before tax of Rs 40.205 crore. Operating profit before working-capital changes was Rs 59.336 crore, but changes in working capital used Rs 158.317 crore.
After the working-capital movement, cash generated or used from operations was negative Rs 98.981 crore, and direct taxes paid were Rs 7.192 crore. The presentation reports the movement but does not identify its individual working-capital components.
Investing activities used Rs 112.144 crore in the Sep-26 column, while financing activities provided Rs 213.77 crore. Net cash and cash equivalents decreased by Rs 4.547 crore, compared with an increase of Rs 22.8 lakh in the Mar-26 column.
Financing cash inflow was Rs 174.882 crore higher in Sep-26 than the Rs 38.888 crore reported in Mar-26, while operating cash outflow increased from Rs 17.733 crore to Rs 106.173 crore. These movements appear alongside the H1 FY27 debt-to-equity ratio of 3.0 times, but BWL does not specify the financing instruments used.
Conclusion
BWL's reported figures show higher scale and improved operating profitability alongside increased leverage. Revenue rose from Rs 97.982 crore in FY23 to Rs 483.293 crore in H1 FY27, EBITDA margin increased from 3.9% to 12.2%, and Air Freight's revenue share rose to 20.3% from 1.1% in FY25. However, PAT margin declined to 6.2% from 6.5% in FY26, while debt-to-equity increased to 3.0 times.
The next disclosures to watch are the working-capital movement of Rs 158.317 crore used in Sep-26, the related financing inflow of Rs 213.77 crore and any change in the 3.0-times debt-to-equity ratio. The presentation provides no leverage target, debt-maturity plan or segment-margin disclosure, leaving those matters unresolved.