










BRG Operating Cash Flow Reaches Rs 22.26 Crore in H1 FY27
Key highlights
- BRG generated Rs 22.26 crore of operating cash in H1 FY27, versus Rs 1.94 crore in FY26.
- BRG's cash and cash equivalents rose to Rs 33.07 crore on September 30, 2026, from Rs 30.05 crore on March 31, 2026.
- BRG's capital work-in-progress increased to Rs 11.77 crore from Rs 2.15 crore during H1 FY27.
- BRG reported debt-to-equity of 0.27 in H1 FY27, compared with 0.28 in FY26.
powered by IRIS
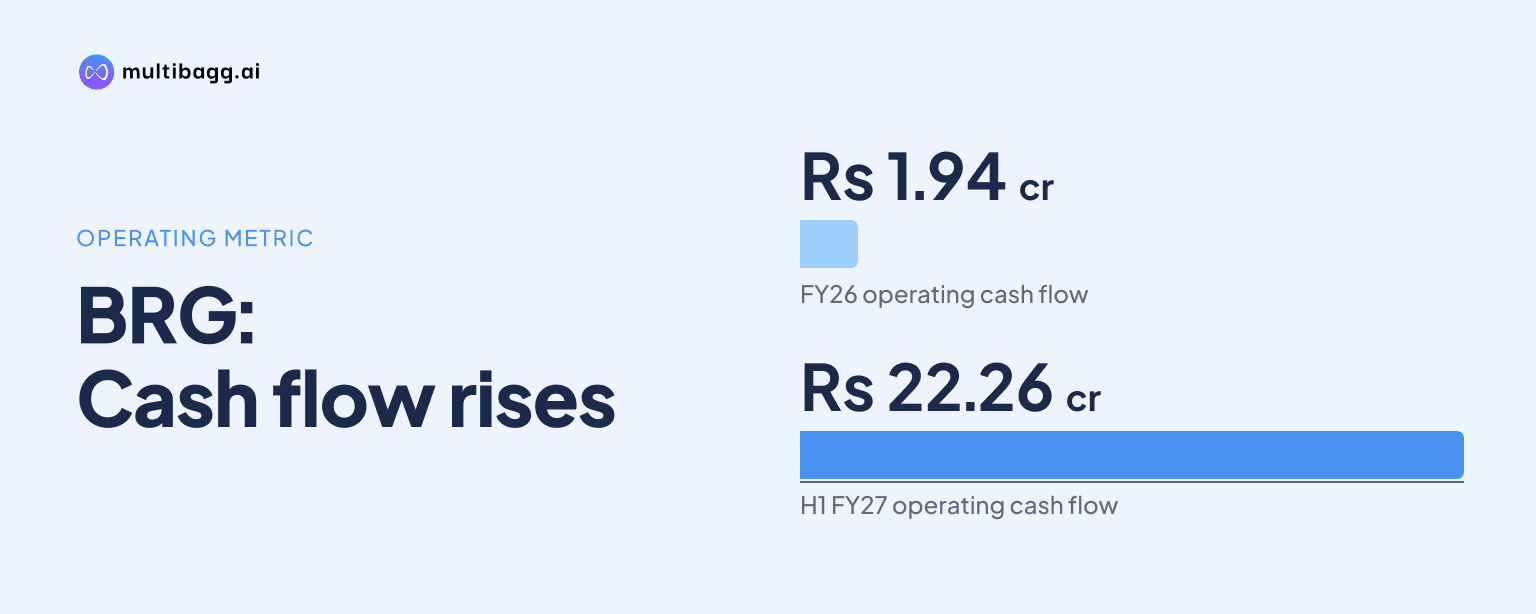
B.R.Goyal Infrastructure Ltd generated Rs 22.26 crore of cash flow from operations in H1 FY27, compared with Rs 1.94 crore in FY26 and an outflow of Rs 36.43 crore in FY25. BRG also reported debt-to-equity of 0.27 in H1 FY27, down from 0.28 in FY26, while short-term loans and advances rose to Rs 59.35 crore.
Know B.R.Goyal Infrastructure inside out
Results, valuation, peers and who's buying, in one view.
What changed in BRG operating cash flow?
BRG’s operating cash flow was Rs 22.26 crore in H1 FY27, reversing the low Rs 1.94 crore recorded for the full FY26 and the Rs 36.43 crore operating outflow in FY25. The H1 FY27 figure was also above the Rs 11.94 crore reported in FY24, though it remained marginally below the Rs 22.73 crore recorded in FY23. The presentation therefore shows a marked improvement from the two immediately preceding full financial years.
BRG’s H1 FY27 operating inflow was nearly offset by Rs 21.60 crore of investment cash outflow, while financing activities added Rs 2.37 crore. The resulting total cash inflow was Rs 3.03 crore for H1 FY27. This differs from FY26, when an operating inflow of Rs 1.94 crore was accompanied by Rs 35.21 crore of investment outflow and Rs 2.25 crore of financing outflow, producing total cash outflow of Rs 35.52 crore.
How did BRG's cash balance move in H1 FY27?
BRG’s cash and cash equivalents increased to Rs 33.07 crore on September 30, 2026, from Rs 30.05 crore on March 31, 2026. That Rs 3.02 crore rise broadly corresponds with the Rs 3.03 crore total cash inflow reported for H1 FY27, with the small difference reflecting the rounded figures presented in crore.
The cash-flow statement shows that operating cash was the principal positive component in H1 FY27, at Rs 22.26 crore, rather than financing cash flow of Rs 2.37 crore. In FY25, by contrast, BRG reported Rs 91.51 crore of financing cash inflow alongside Rs 36.43 crore of operating cash outflow. The composition of cash movement in H1 FY27 was therefore different from FY25, when financing activity was the larger source of cash.
BRG’s H1 FY27 investment cash outflow of Rs 21.60 crore was lower than the Rs 35.21 crore outflow in FY26 but higher than the Rs 18.70 crore outflow in FY25. The presentation does not provide an investment-level breakdown of the H1 FY27 outflow. Its reported total cash flow of Rs 3.03 crore compared with a Rs 35.52 crore total outflow in FY26.
Got a follow-up? Ask IRIS
What changed in BRG's balance sheet by September 2026?
BRG’s total assets increased to Rs 476.87 crore on September 30, 2026, from Rs 458.17 crore on March 31, 2026. The increase was accompanied by shareholders’ funds rising to Rs 298.82 crore from Rs 274.02 crore, while total liabilities, comprising non-current and current liabilities, declined to Rs 178.06 crore from Rs 184.15 crore.
Within BRG’s assets, capital work-in-progress increased to Rs 11.77 crore from Rs 2.15 crore, and short-term loans and advances rose to Rs 59.35 crore from Rs 39.41 crore. Other current assets increased to Rs 46.34 crore from Rs 37.12 crore. These increases occurred while inventories declined to Rs 123.48 crore from Rs 149.54 crore and long-term loans and advances declined to Rs 40.22 crore from Rs 45.70 crore.
On the liabilities side, BRG’s current borrowings increased to Rs 49.42 crore from Rs 45.43 crore, while non-current borrowings were almost unchanged at Rs 31.01 crore versus Rs 30.98 crore. Payables to other creditors declined to Rs 24.37 crore from Rs 34.80 crore. The balance-sheet movement thus included higher current borrowings but lower total current liabilities, which fell to Rs 89.30 crore from Rs 92.88 crore.
How did BRG's earnings and leverage ratios compare?
BRG reported operational revenue of Rs 549.71 crore in H1 FY27, up 60.67% from Rs 342.13 crore in H1 FY26, while profit after tax rose 37.82% to Rs 22.12 crore. Earnings before interest, tax, depreciation and amortisation, or EBITDA, increased to Rs 35.06 crore from Rs 27.47 crore, but the EBITDA margin declined by 165 basis points to 6.38% from 8.03%.
BRG’s debt-to-equity ratio was 0.27 in H1 FY27, compared with 0.28 in FY26 and 0.31 in FY25. Its debt service coverage ratio was 4.55 in H1 FY27, versus 1.46 in FY26 and 2.31 in FY25. The presentation also shows return on equity of 15.00% and return on capital employed of 16.29% in H1 FY27, compared with 18.00% and 20.00%, respectively, in FY26.
Conclusion
BRG’s H1 FY27 figures show operating cash flow of Rs 22.26 crore after Rs 1.94 crore in FY26 and a Rs 36.43 crore outflow in FY25. At the same time, total assets rose by Rs 18.70 crore to Rs 476.87 crore, shareholders’ funds rose by Rs 24.80 crore to Rs 298.82 crore, and the reported debt-to-equity ratio moved down to 0.27.
The next disclosures to watch are whether BRG can maintain operating cash generation while capital work-in-progress stands at Rs 11.77 crore and short-term loans and advances at Rs 59.35 crore. Management’s stated plan is to pursue 20% to 25% compound annual growth over the next five years, target large public-private partnership projects, expand into new regions and maintain working-capital discipline.