










Britannia Q2 margin returns to 17% amid input inflation
Key highlights
- Britannia's Q2'27 profit-from-operations margin rose to 17.0% from 15.3% in Q1'27.
- Britannia reported Q2'27 net sales of Rs 5,542 crore, up 16.6% year on year.
- Refined palm oil, milk and laminate rose 17%, 16% and 18% year on year, respectively, in Q2'27.
- Britannia's H1'27 operating profit was Rs 1,704 crore, up 10.3% year on year.
powered by IRIS
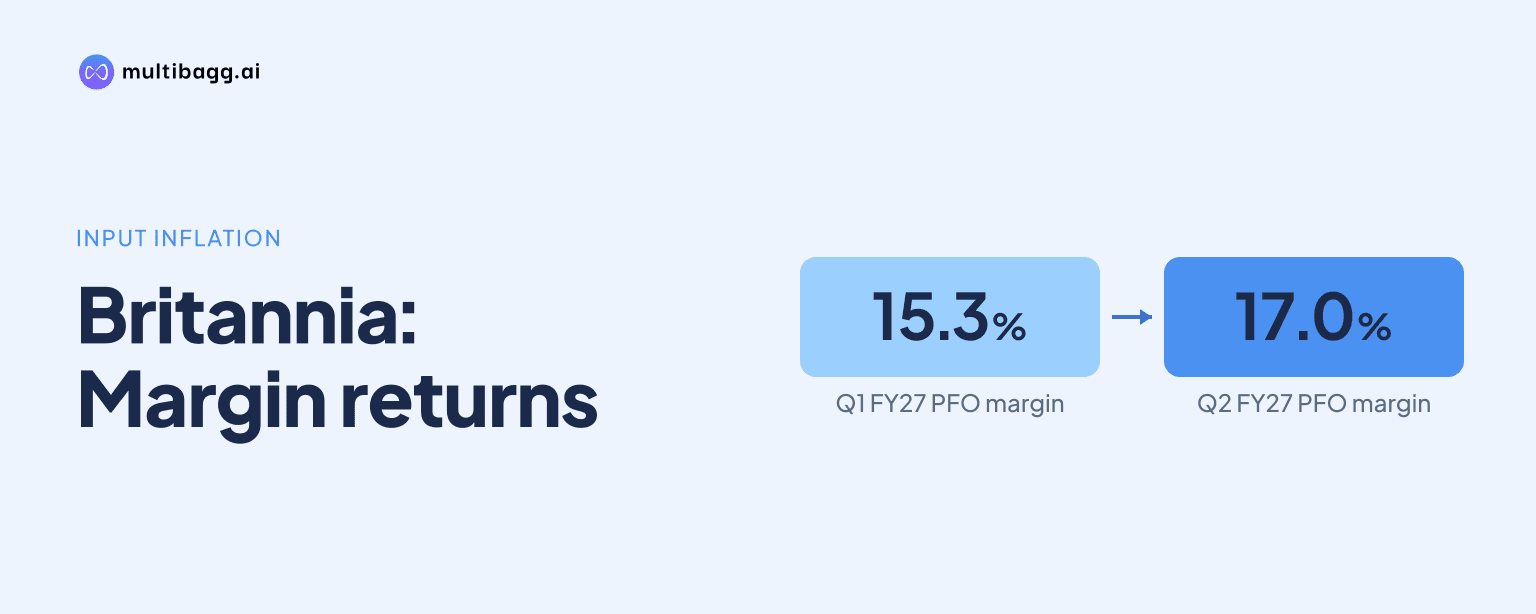
Britannia reported a 17.0% profit-from-operations margin in the second quarter of 2026-27, up from 15.3% in Q1'27, while consolidated net sales rose 16.6% year on year to Rs 5,542 crore. The presentation says strategic commodity covers kept input costs below market prices.
Know Britannia Industries inside out
Results, valuation, peers and who's buying, in one view.
How did Britannia's Q2 margin change?
Britannia's profit-from-operations margin rose by 1.7 percentage points sequentially to 17.0% in Q2'27 from 15.3% in Q1'27. Consolidated operating profit was Rs 943 crore in Q2'27, against net sales of Rs 5,542 crore, according to the consolidated financial lines. The movement returned the margin to the 17.0% level reported for the full year (FY) 2025-26.
The margin recovery also extended below the operating line. Profit before tax (PBT) margin rose to 17.6% in Q2'27 from 16.1% in Q1'27, while profit after tax (PAT), owner's share, margin increased to 13.0% from 11.9%. Britannia reported Q2'27 PBT of Rs 977 crore and PAT attributable to owners of Rs 721 crore.
Britannia's 17.0% Q2'27 operating margin was 0.3 percentage points below the 17.3% recorded in FY 2023-24, the highest annual figure in the series shown. It was above the 16.4% reported in FY 2024-25. The presentation therefore shows a sequential recovery in Q2 rather than a margin above every annual level in the displayed data.
Which Britannia input costs increased in Q2'27?
Britannia faced higher market prices for refined palm oil, milk, laminate, sugar and industrial fuel in Q2'27, while flour was lower than a year earlier. Laminate rose 18% versus Q2'26, refined palm oil increased 17%, and milk was up 16%. The company presents these movements using average actual consumption rates for the quarter.
Industrial fuel recorded the largest year-on-year increase among the listed inputs, at 45% versus Q2'26, although it was 21% lower than in Q1'27. This shows that the quarterly movement differed from the annual comparison for fuel. Flour also moved differently from the other inputs, increasing 9% versus Q1'27 but declining 4% versus Q2'26.
Britannia states that strategic covers enabled its input costs to remain below market prices. The presentation does not disclose the duration, volumes, instruments or financial benefit of those covers. The stated mechanism helps explain why profitability recovered alongside higher market input trends, but the commodity-cost saving cannot be quantified from the disclosed figures.
Got a follow-up? Ask IRIS
How did Britannia's Q2 profit growth compare with sales growth?
Britannia's Q2'27 net sales grew 16.6% year on year to Rs 5,542 crore, faster than the 8.5% increase in operating profit to Rs 943 crore. PBT grew 10.6% to Rs 977 crore and PAT, owner's share, increased 10.2% to Rs 721 crore. All three reported profit lines rose, but each increased more slowly than sales in the quarter.
Sequentially, consolidated sales increased by Rs 578 crore from Rs 4,964 crore in Q1'27 to Rs 5,542 crore in Q2'27. The presentation separately reports 12-month growth of 17% for Q2 in its revenue-trends series, while the published-results financial table gives 16.6% Q2 sales growth. Britannia labels the latter as the year-on-year change in consolidated net sales.
The sales progression shows that Q2'27 exceeded the Rs 4,752 crore recorded in Q2'26 by Rs 790 crore. Sales had moved from Rs 4,370 crore in Q2 of FY 2023-24 to Rs 4,566 crore in Q2 of FY 2024-25, then Rs 4,752 crore in Q2'26. Q2'27 was therefore the highest Q2 sales figure in the displayed four-year sequence.
What do Britannia's H1'27 figures say about margins?
Britannia reported H1'27 consolidated net sales of Rs 10,506 crore, up 13.1% year on year, while operating profit increased 10.3% to Rs 1,704 crore. For the first half, profit from operations was 16.2%, below the 17.0% achieved in Q2'27 and below the 17.0% reported in FY 2025-26. The lower 15.3% operating margin in Q1'27 affected the half-year outcome.
H1'27 PBT was Rs 1,775 crore, a 12.0% year-on-year increase, and PAT attributable to owners was Rs 1,312 crore, up 11.7%. The corresponding H1 margins were 16.9% for PBT and 12.5% for PAT. Both were below the Q2'27 levels of 17.6% and 13.0%, respectively, but above the Q1'27 levels of 16.1% and 11.9%.
The half-year comparison places the Q2 rebound in context. H1'27's 16.2% profit-from-operations margin was 0.8 percentage points lower than FY 2025-26's 17.0%, even as first-half sales passed Rs 10,000 crore. Britannia provides no H1 commodity-cover benefit in rupees, so the effect of input-cost protection on the half-year margin cannot be calculated from the presentation.
Conclusion
Britannia's Q2'27 results combine a return to a 17.0% profit-from-operations margin with sales growth of 16.6% to Rs 5,542 crore. This occurred while refined palm oil, milk and laminate were 17%, 16% and 18% higher year on year, respectively, and industrial fuel was 45% higher.
The next issue is whether the Q2 recovery can continue as commodity prices change. Britannia identifies strategic covers as the mechanism keeping input costs below market prices, but the presentation leaves the cover duration, volumes and financial benefit unresolved.