










Britannia Q2’27 revenue rises 16.6% to Rs 5,542 crore
Key highlights
- Britannia reported Q2’27 revenue from operations of Rs 5,542 crore, up 16.6% on its stated 12-month comparison.
- Britannia’s Q2’27 revenue growth versus Q1’27 was 11.6%.
- Owner’s share of profit after tax was 13.0% of Q2’27 revenue, compared with 12.5% for H1’27.
- E-commerce contributed about 7%, while other channels grew at 1.8 times the general-trade rate.
powered by IRIS
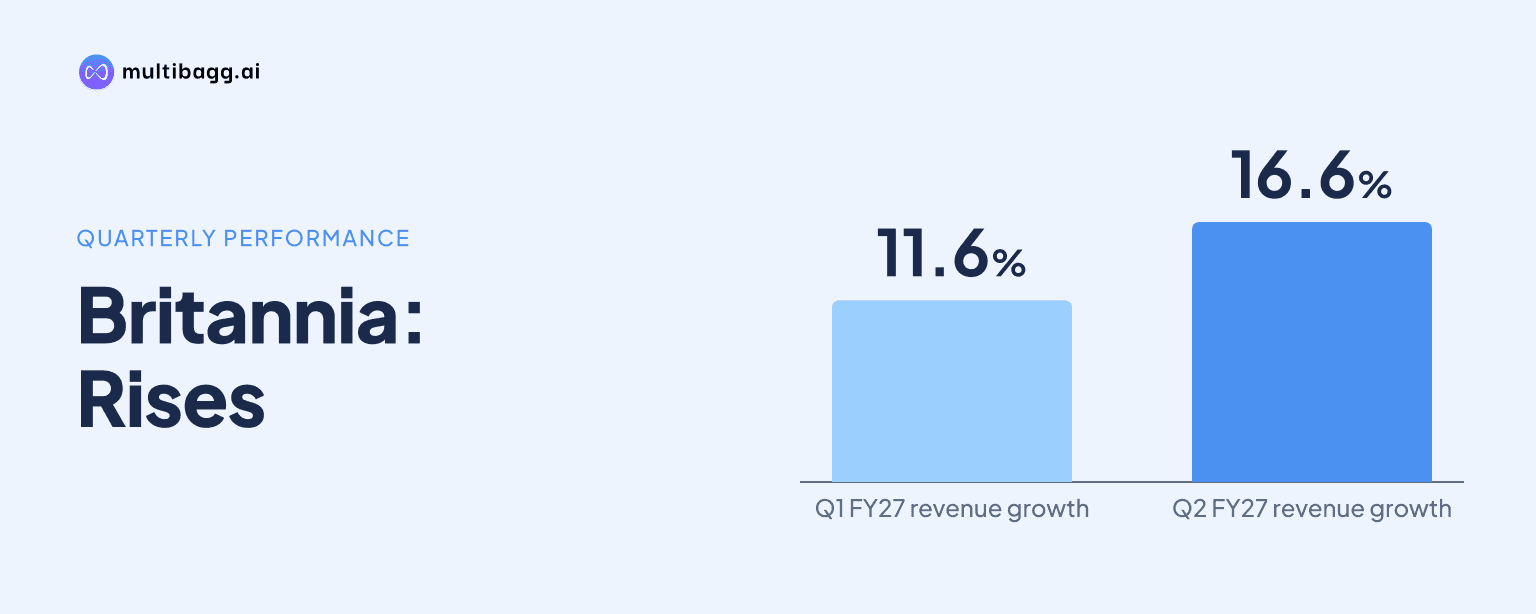
Britannia reported Rs 5,542 crore of consolidated revenue from operations in Q2’27, with 16.6% growth on the presentation’s stated 12-month comparison and 11.6% growth versus Q1’27. Owner’s share of profit after tax was 13.0% of revenue, while H1’27 revenue reached Rs 10,506 crore.
Know Britannia Industries inside out
Results, valuation, peers and who's buying, in one view.
How quickly did Britannia’s revenue grow in Q2’27?
Britannia’s revenue from operations grew 16.6% in Q2’27 on the scorecard’s stated 12-month comparison, reaching Rs 5,542 crore. The company also reported 11.6% growth versus Q1’27, giving both an annual comparison measure and a quarter-on-quarter comparison on the same Q2’27 scorecard.
The presentation labels the results as consolidated company financials. It does not disclose the prior-period revenue amount behind the 16.6% growth figure, nor does it provide a standalone Q1’27 revenue figure alongside the 11.6% comparison. The reported Rs 5,542 crore is therefore the disclosed Q2’27 revenue figure rather than a segment or channel sales total.
The Q2’27 growth rate of 16.6% was 3.5 percentage points above the 13.1% rate reported for H1’27. This is a comparison between a quarter and the first-half total, rather than a like-for-like comparison with Q1’27, but it shows that the scorecard recorded a higher growth rate in Q2’27 than for H1’27 overall.
How did Q2’27 compare with Britannia’s first-half result?
Britannia reported H1’27 revenue from operations of Rs 10,506 crore, up 13.1% on its stated 12-month comparison. Q2’27 revenue of Rs 5,542 crore was reported separately, with a 16.6% growth rate on the same labelled comparison measure and 11.6% growth versus Q1’27.
The presentation does not provide a separate Q1’27 revenue amount, so it does not allow a direct reconstruction of quarterly revenue from the figures displayed. It also does not disclose product-category sales, domestic revenue, export revenue, or regional revenue totals for either Q2’27 or H1’27.
The results nevertheless show a change in the reported growth rate. H1’27 revenue growth was 13.1%, while Q2’27 revenue growth was 16.6%, a 3.5-percentage-point difference. Britannia’s scorecard does not attribute that difference to volumes, pricing, mix, product launches, distribution additions, or any specific category.
What did Britannia report on profit after tax?
Britannia reported owner’s share of profit after tax equal to 13.0% of revenue in Q2’27. That profit measure recorded 10.2% growth on the stated 12-month comparison and 21.9% growth versus Q1’27, according to the consolidated-results scorecard.
For H1’27, owner’s share of profit after tax was 12.5% of revenue, with 11.7% growth on the presentation’s 12-month comparison. The Q2’27 ratio was therefore 0.5 percentage points above the H1’27 ratio, although the first-half figure covers a different reporting period and includes more than one quarter.
Britannia did not disclose an absolute profit-after-tax amount on the two scorecard pages. It also did not provide prior-period profit ratios, operating profit, gross margin, finance costs, tax expense, commodity costs, or currency effects in the supplied presentation pages. The disclosed measures are the 13.0% Q2’27 and 12.5% H1’27 shares of revenue and their respective growth rates.
Got a follow-up? Ask IRIS
Which channels did Britannia identify as growth drivers?
Britannia said growth was broad-based across all channels in Q2’27. General trade growth in Q2’27 was 2.6 times the level of FY 25-26, according to the channel performance slide, although the presentation does not disclose the underlying percentage growth rate for either period.
Other channels continued to grow faster, at 1.8 times the general-trade growth rate. E-commerce contributed about 7%, as stated on the same Q2’27 slide. Britannia does not specify whether that approximately 7% contribution refers to consolidated revenue, domestic revenue, a sales channel subset, or another defined revenue base.
The company’s stated strategic priorities include efficiencies in sales, distribution and supply chain, along with brand experiences and investments. These mechanisms appear beside the Q2’27 channel update, but the presentation gives no rupee savings target, distribution outlet target, e-commerce sales amount, or timetable for the stated efficiency initiatives.
What did Britannia disclose about growth in key states?
Britannia said key-state growth in Q2’27 was 2.8 times that of FY 25-26. The company also said key states contribute more than 50% of domestic revenue, making the disclosed acceleration relevant to more than half of its domestic revenue base.
Other states continued to outpace key states, according to the Q2’27 state-growth slide. Britannia does not identify the states in either group, disclose the percentage growth rate for key states or other states, or provide revenue amounts for the two groups. The available disclosure is therefore directional: key-state growth accelerated relative to FY 25-26, but other-state growth remained faster.
The state discussion sits within Britannia’s stated priority of winning in “Many Indias.” Its other listed priorities are innovation, adjacencies and future platforms, sustainability, sales and distribution and supply-chain efficiencies, and elevated brand experiences and investments. No numeric target, spending commitment, or delivery date is supplied for these priorities.
Conclusion
Britannia’s Q2’27 scorecard shows Rs 5,542 crore of revenue from operations, 16.6% growth on its stated 12-month comparison and 11.6% growth versus Q1’27. The company also reported owner’s share of profit after tax at 13.0% of revenue, compared with 12.5% for H1’27, while noting faster growth in other channels than general trade and in other states than key states.
The next disclosed items to watch are the execution of Britannia’s sales, distribution and supply-chain efficiency plans, its innovation and future-platform priorities, and the reported contribution of e-commerce, currently about 7%. Management’s safe-harbor statement identifies general economic conditions, commodities and currency fluctuations, competitive product and pricing pressures, industrial relations and regulatory developments as risks that could affect future outcomes.