










Cantabil Q2 Revenue Rises 9% as Pre-Ind AS 116 PAT Falls 35%
Key highlights
- Cantabil’s Q2 FY27 revenue rose 9% year on year to Rs 191.7 crore.
- Cantabil’s pre-Ind AS 116 Q2 FY27 PAT fell 35% to Rs 5.7 crore from Rs 8.9 crore.
- Cantabil’s reported Q2 FY27 EBITDA margin declined to 23.2% from 23.9%.
- Cantabil added 23 net stores in Q2 FY27, taking its network to 690 stores.
powered by IRIS
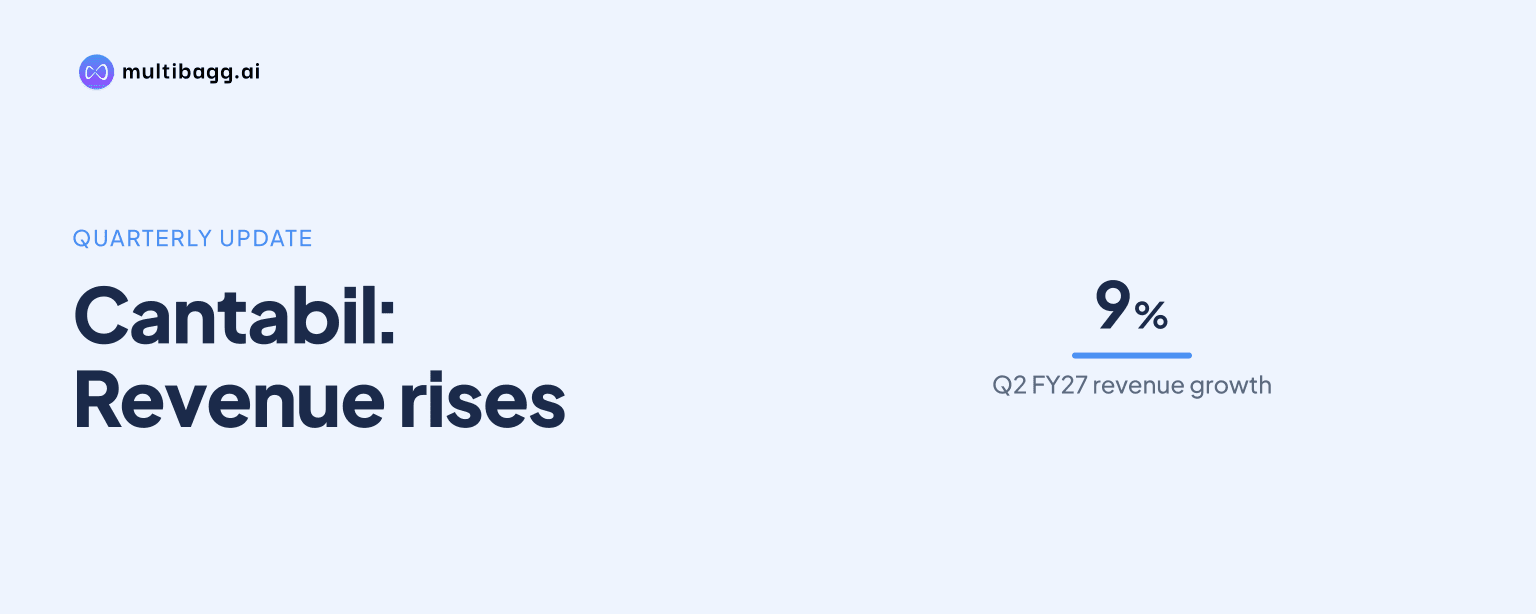
Cantabil reported Q2 FY27 revenue of Rs 191.7 crore, up 9% year on year, while its pre-Ind AS 116 profit after tax (PAT) fell 35% to Rs 5.7 crore from Rs 8.9 crore. Higher employee and other expenses reduced pre-Ind AS 116 profitability, although reported PAT increased 4% to Rs 7.0 crore.
Know Cantabil Retail India inside out
Results, valuation, peers and who's buying, in one view.
Why did Cantabil’s pre-Ind AS 116 profit fall in Q2 FY27?
Cantabil’s pre-Ind AS 116 PAT fell because operating costs increased faster than revenue in Q2 FY27. Revenue from operations increased by Rs 15.7 crore to Rs 191.7 crore, while employee expenses rose by Rs 7.3 crore to Rs 46.8 crore and other expenses increased by Rs 9.2 crore to Rs 73.9 crore. Pre-Ind AS 116 earnings before interest, tax, depreciation and amortisation (EBITDA) consequently declined 11% to Rs 14.7 crore from Rs 16.6 crore.
The decline continued below EBITDA. Pre-Ind AS 116 profit before tax (PBT) declined 37% to Rs 7.2 crore from Rs 11.3 crore, and its PBT margin contracted to 3.7% from 6.4%. Tax reduced to Rs 1.4 crore from Rs 2.5 crore, but PAT still declined to Rs 5.7 crore from Rs 8.9 crore and the PAT margin fell to 3.0% from 5.0%.
How did Cantabil’s reported and pre-Ind AS 116 profits differ?
Cantabil’s reported Q2 FY27 PAT increased 4% to Rs 7.0 crore, whereas pre-Ind AS 116 PAT decreased 35% to Rs 5.7 crore. In the reported presentation, EBITDA increased 5% to Rs 44.4 crore from Rs 42.1 crore, while PBT rose 5% to Rs 8.9 crore from Rs 8.5 crore. Reported PAT margin was 3.7%, compared with 3.8% in Q2 FY26.
The two presentations show different classifications for lease-related costs. Reported other expenses were Rs 44.3 crore, depreciation was Rs 30.0 crore and finance cost was Rs 9.1 crore; the pre-Ind AS 116 presentation showed Rs 73.9 crore, Rs 8.6 crore and Rs 1.0 crore respectively. The source does not provide a further reconciliation, but the displayed classifications produce different EBITDA, PBT and PAT outcomes.
Which costs compressed Cantabil’s quarterly margin?
Cantabil’s reported EBITDA margin narrowed to 23.2% in Q2 FY27 from 23.9% in Q2 FY26 as employee, administrative and marketing costs took a larger share of sales. Employee expense rose to 17.7% of net sales from 16.9%, administrative and other expense increased to 14.4% from 14.2%, and marketing expense rose to 2.0% from 1.4%. Cost of goods sold (COGS) fell to 42.7% from 43.6%.
The operational matrix shows net sales of Rs 192 crore in Q2 FY27 against Rs 176 crore a year earlier. Employee expense increased to Rs 34 crore from Rs 30 crore, administrative and other expense rose to Rs 28 crore from Rs 25 crore, and marketing expense doubled to Rs 4 crore from Rs 2 crore. EBITDA increased to Rs 44 crore from Rs 42 crore, but the higher operating-cost shares reduced the margin.
H1 FY27 showed a different reported margin trend. Net sales increased to Rs 371 crore from Rs 335 crore, EBITDA rose to Rs 104 crore from Rs 91 crore, and EBITDA margin expanded to 28.0% from 27.2%. COGS fell to 37.3% of sales from 39.4%, more than offsetting increases in employee expense to 17.8%, administrative and other expense to 14.7%, and marketing expense to 2.1%.
Got a follow-up? Ask IRIS
Did Cantabil’s store expansion produce comparable-store sales growth?
Cantabil added 23 net stores in Q2 FY27, taking the network to 690 stores, but same-store growth (SSG) was negative 2.03% for the quarter. Retail area increased to 9.89 lakh square feet from 8.64 lakh square feet in Q2 FY26. The 9% revenue increase therefore coincided with a larger store base rather than positive quarterly comparable-store sales growth.
Average bill value (ABV) increased to Rs 4,049 from Rs 3,890 and average selling price (ASP) rose to Rs 859 from Rs 826. Volume growth was 6.02% year on year, while sales per square foot (PSF) declined to Rs 608 from Rs 637. These measures show higher transaction values and volume alongside lower sales productivity per square foot.
For H1 FY27, Cantabil added 38 net stores and SSG was positive at 0.88%. H1 ABV rose to Rs 4,307 from Rs 4,021, ASP increased to Rs 965 from Rs 918, and volume grew 6.72%. However, H1 PSF declined to Rs 609 from Rs 623, leaving space productivity below the prior-year level.
What do Cantabil’s cash flow and balance sheet show?
Cantabil generated Rs 44 crore of net cash from operating activities in H1 FY27, compared with Rs 36 crore in H1 FY26. Cash generated from operations rose to Rs 61 crore from Rs 51 crore, while working-capital changes used Rs 45 crore against Rs 42 crore a year earlier. Direct taxes paid increased to Rs 17 crore from Rs 15 crore.
Investing cash outflow was Rs 30 crore and financing cash outflow was Rs 36 crore in H1 FY27, compared with Rs 33 crore and Rs 16 crore respectively in H1 FY26. Closing cash balance was Rs 3 crore, against Rs 15 crore at the end of H1 FY26 and Rs 25 crore at the beginning of FY27. The net change in cash was an outflow of Rs 22 crore, compared with Rs 13 crore in H1 FY26.
At September 2026, total assets were Rs 1,050.0 crore compared with Rs 1,149.8 crore at March 2026. Inventory increased to Rs 346.6 crore from Rs 295.0 crore, while cash and cash equivalents declined to Rs 3.6 crore from Rs 25.4 crore. Equity rose to Rs 494.9 crore from Rs 478.0 crore, and current borrowings were Rs 27.2 crore compared with nil at March 2026.
Conclusion
Cantabil’s Q2 FY27 result combined 9% revenue growth with diverging profit measures. Reported PAT rose 4% to Rs 7.0 crore, but the pre-Ind AS 116 view showed EBITDA down 11%, PBT down 37% and PAT down 35%, reflecting higher employee and other expenses. The reported EBITDA margin also declined by 0.7 percentage points to 23.2% despite a lower COGS share.
What to watch next is whether Cantabil’s expanded 690-store network can restore quarterly SSG from negative 2.03% and lift PSF from Rs 608. The company added 38 net stores in H1 FY27, while H1 pre-Ind AS 116 PAT rose only 3% to Rs 25.9 crore, making future expense progression, inventory movement and cash generation relevant disclosed measures.