










Cantabil delivered 22% revenue CAGR and 31% FY26 EBITDA margin
Key highlights
- Cantabil reported FY26 revenue from operations of Rs 852.6 crore, up from Rs 383.4 crore in FY22.
- Cantabil reported FY26 EBITDA of Rs 264.3 crore and an EBITDA margin of 31.0%.
- Cantabil reported FY26 profit after tax of Rs 95.8 crore, compared with Rs 74.9 crore in FY25.
- Cantabil had 526 COCO stores and 126 FOFO stores in FY26.
powered by IRIS
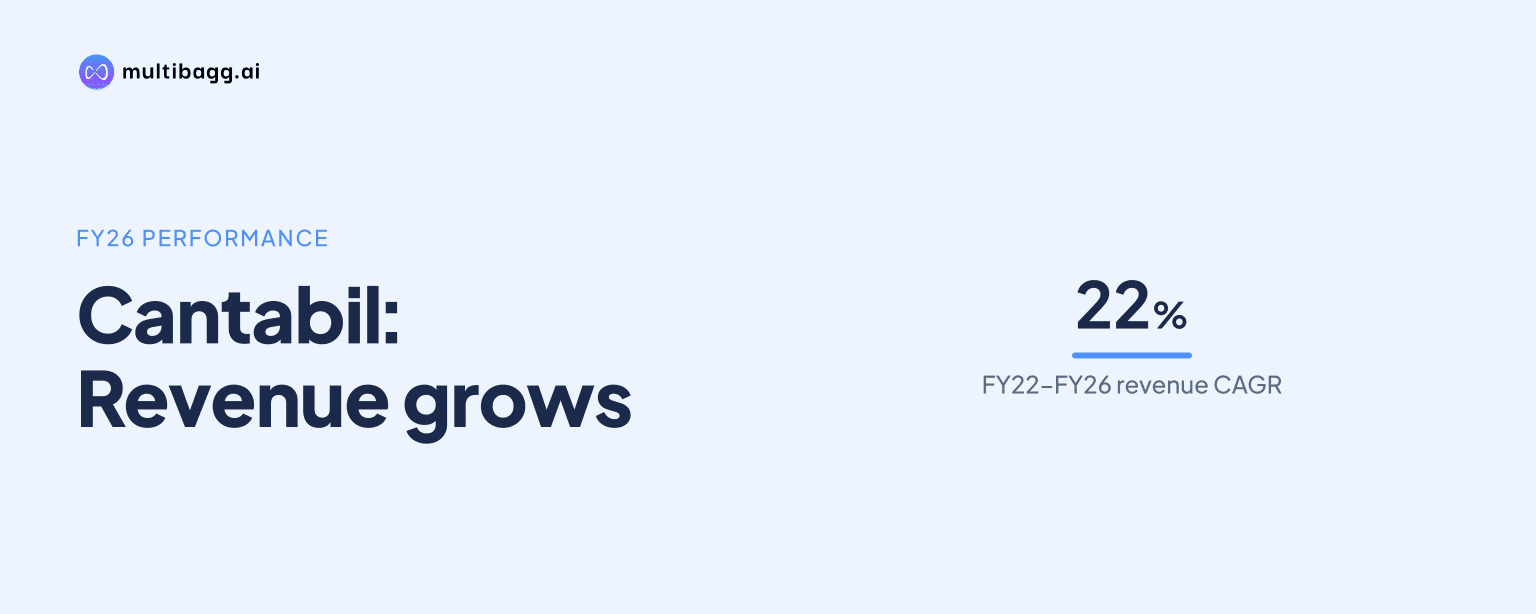
Cantabil Retail India Limited delivered a 22% revenue compound annual growth rate from FY22 to FY26, reaching Rs 852.6 crore, while reported earnings before interest, tax, depreciation and amortisation (EBITDA) margin increased to 31.0% from 28.7%. Cantabil also reported FY26 profit after tax of Rs 95.8 crore and 526 company-operated stores.
Know Cantabil Retail India inside out
Results, valuation, peers and who's buying, in one view.
How did Cantabil's revenue and profit change from FY22 to FY26?
Cantabil increased revenue from operations from Rs 383.4 crore in FY22 to Rs 852.6 crore in FY26, a Rs 469.2 crore increase and the 22% CAGR stated in the presentation. Revenue rose to Rs 552.8 crore in FY23, Rs 615.6 crore in FY24 and Rs 721.1 crore in FY25. Reported EBITDA increased from Rs 111.7 crore to Rs 264.3 crore, a stated 24% CAGR.
Cantabil's profit after tax, or PAT, rose at a stated 26% CAGR from Rs 38.1 crore in FY22 to Rs 95.8 crore in FY26. FY24 interrupted the prior-year increase: EBITDA was Rs 162.7 crore versus Rs 164.7 crore in FY23, and PAT was Rs 62.2 crore versus Rs 67.2 crore. By FY26, finance cost had increased to Rs 48.0 crore from Rs 24.0 crore in FY22, while depreciation rose to Rs 99.7 crore from Rs 43.3 crore.
How did Cantabil's margins change over the five years?
Cantabil's reported EBITDA margin increased by 2.3 percentage points to 31.0% in FY26 from 28.7% in FY22, after declining to 26.4% in FY24. Gross margin rose from 55% to 60% over the period, while gross profit increased from Rs 209 crore to Rs 515 crore. Gross margin was 56% in FY23 and FY24, then reached 59% in FY25.
Cantabil's FY26 profit-before-tax margin was 14.8%, below 15.5% in both FY22 and FY23, while its PAT margin reached 11.2% from 9.9% in FY22 but remained below FY23's 12.2%. The presentation also shows a pre-Indian Accounting Standards, or pre-Ind AS, view: FY26 EBITDA was Rs 162.1 crore and its margin was 19.0%, compared with Rs 264.3 crore and 31.0% in the reported table. The source does not explain the difference between these presentations.
What operating scale accompanied Cantabil's revenue growth?
Cantabil's combined COCO and FOFO store count rose to 652 in FY26 from 377 in FY22, while retail area increased to 9.1 lakh square feet from 4.3 lakh square feet. COCO stores increased from 271 to 526, whereas FOFO stores rose from 106 to 126 after reaching 136 in FY25. The presentation does not expand the COCO and FOFO abbreviations.
Cantabil's monthly sales per square foot declined to Rs 768 in FY26 from Rs 903 in FY23, although it was slightly above Rs 763 in FY25. COCO contributed 81% of FY26 revenue, up from 76% in FY24, while FOFO contributed 19%, down from 24%. The FY26 portfolio comprised 351 mens stores, 238 family stores and 63 ladies and kids stores; men's wear represented 81% of revenue and the North zone 58%.
Got a follow-up? Ask IRIS
What do Cantabil's balance sheet and return ratios show?
Cantabil reported total assets of Rs 1,149.8 crore at March 2026, compared with Rs 941.2 crore at March 2025 and Rs 774.4 crore at March 2024. Non-current assets were Rs 769.1 crore, including Rs 485.3 crore of right-of-use assets and Rs 206.9 crore of property, plant and equipment. Current assets totalled Rs 380.6 crore, with inventories of Rs 295.0 crore and cash and cash equivalents of Rs 25.4 crore.
Cantabil's equity increased to Rs 478.0 crore at March 2026 from Rs 393.1 crore a year earlier, while total lease liabilities were Rs 544.1 crore, comprising Rs 482.6 crore non-current and Rs 61.5 crore current. The balance sheet reported zero current and non-current borrowings at March 2026, compared with Rs 9.8 crore of current borrowings at March 2024. Return on equity was 22.0% in FY26, return on capital employed was 40.2%, and return on assets was 8.3%; all were below their FY23 peaks of 35.3%, 57.1% and 11.0%, respectively.
How did Cantabil's working-capital indicators move in FY26?
Cantabil reduced inventory days to 126 in FY26 from 141 in FY25 and 140 in FY22. Working-capital days declined to 104 from 113 in FY25, although they remained above FY22's 95 days. The presentation defines working-capital days as inventory days plus debtor days minus creditor days.
Cantabil's inventory reduction in days occurred while closing inventories increased to Rs 295.0 crore at March 2026 from Rs 279.1 crore at March 2025, alongside revenue growth to Rs 852.6 crore from Rs 721.1 crore. Trade receivables declined to Rs 12.5 crore from Rs 13.4 crore, and trade payables fell to Rs 64.6 crore from Rs 69.3 crore over the same dates.
Conclusion
Cantabil's FY22 to FY26 record shows revenue growth alongside higher gross margin, reported EBITDA margin and PAT. Revenue rose by Rs 469.2 crore to Rs 852.6 crore, gross margin increased by 5 percentage points to 60%, and reported EBITDA margin rose by 2.3 percentage points to 31.0%. The retail footprint also expanded by 275 combined COCO and FOFO stores to 652.
The unresolved item to watch in subsequent disclosures is the difference between the reported FY26 EBITDA of Rs 264.3 crore and the pre-Ind AS EBITDA of Rs 162.1 crore, because the presentation does not state the reason for the differing views. Operating disclosures will also show whether FY26 sales per square foot of Rs 768 and working-capital days of 104 change as the 9.1 lakh-square-foot retail area develops.