










Cantabil reaches 690 stores as Q2 sales productivity drops
Key highlights
- Cantabil added 23 net stores in Q2 FY27 and ended the quarter with 690 stores.
- Cantabil reported Q2 FY27 SSG of minus 2.03% and PSF of Rs 608, versus Rs 637 in Q2 FY26.
- Cantabil’s retail area rose to 9.89 lakh sq. ft in Q2 FY27 from 8.64 lakh sq. ft a year earlier.
- Cantabil’s Q2 FY27 revenue rose 9% to Rs 191.7 crore and PAT rose 4% to Rs 7.0 crore.
powered by IRIS
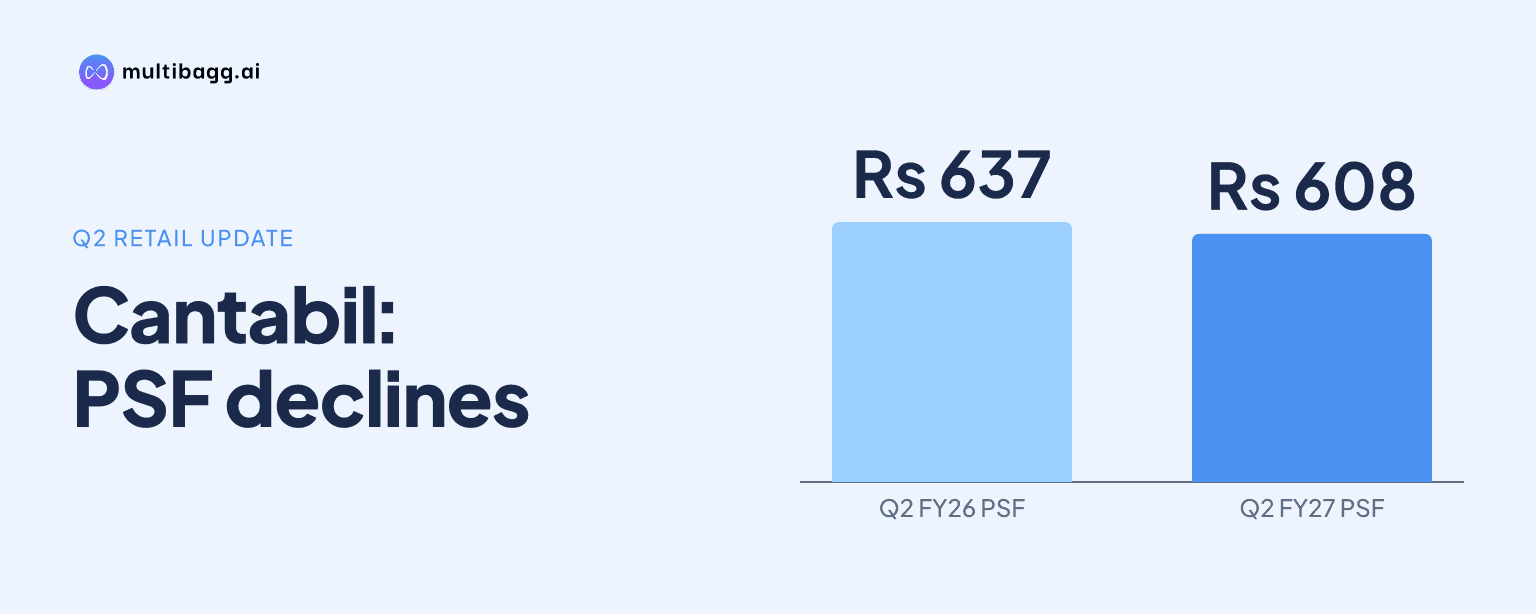
Cantabil Retail India Limited ended the second quarter of financial year 2027, or Q2 FY27, with 690 stores after 23 net additions, but reported same-store growth of minus 2.03% and sales per square foot of Rs 608, down from Rs 637 in Q2 FY26. Retail area nevertheless increased to 9.89 lakh sq. ft.
Know Cantabil Retail India inside out
Results, valuation, peers and who's buying, in one view.
How did Cantabil reach 690 stores?
Cantabil reached 690 stores after adding 23 net stores in Q2 FY27 and 38 net stores in the first half of financial year 2027, or H1 FY27. The presentation gives the same 690-store count for Q2 FY27 and H1 FY27, meaning the quarter’s additions were included within the first-half net increase.
The larger network occupied 9.89 lakh sq. ft at Q2 FY27, compared with 8.64 lakh sq. ft at Q2 FY26. That was an increase of 1.25 lakh sq. ft year on year, alongside the 23 net store additions disclosed for the quarter. The presentation does not provide a store count for Q2 FY26, a format-level split, or the geography and size of the new locations.
Cantabil’s Q2 FY27 revenue from operations rose 9% year on year to Rs 191.7 crore from Rs 176.0 crore. The revenue increase therefore coincided with a larger store estate and retail area, while the comparable-store metric was negative in the quarter. The source does not provide a revenue split between existing stores and recently opened stores.
How did Cantabil’s Q2 store productivity compare with last year?
Cantabil reported same-store growth, or SSG, of minus 2.03% in Q2 FY27, while sales per square foot, or PSF, fell to Rs 608 from Rs 637 in Q2 FY26. The reported metrics show lower comparable-store sales growth and lower sales generated per square foot than in the corresponding quarter a year earlier.
The first-half pattern was less negative on comparable sales but still lower on space productivity. Cantabil reported H1 FY27 SSG of 0.88%, compared with minus 2.03% in Q2 FY27, and H1 FY27 PSF of Rs 609, compared with Rs 623 in H1 FY26. Thus, SSG was positive over six months even though PSF remained below the prior-year half-year figure.
Q2 FY27 PSF of Rs 608 was Rs 1 below the H1 FY27 reading of Rs 609, while Q2 SSG was 2.91 percentage points below the 0.88% H1 figure. The presentation does not explain the Q2 SSG decline or lower PSF through factors such as product mix, discounting, weather, transaction frequency or the contribution of newly opened stores.
Got a follow-up? Ask IRIS
What supported Cantabil’s sales growth despite lower Q2 productivity?
Cantabil reported an average bill value, or ABV, of Rs 4,049 in Q2 FY27, up from Rs 3,890 in Q2 FY26, and an average selling price, or ASP, of Rs 859, up from Rs 826. These higher transaction measures occurred alongside negative SSG and lower PSF in the quarter.
Volume growth was 6.02% year on year in Q2 FY27, compared with the 9% increase in revenue to Rs 191.7 crore. The presentation reports volume, ABV and ASP together, but does not quantify how much of revenue growth came from new stores, pricing, product mix, unit volumes or transaction counts. It therefore records the measures without providing a revenue bridge.
For H1 FY27, ABV rose to Rs 4,307 from Rs 4,021 in H1 FY26, while ASP increased to Rs 965 from Rs 918. H1 FY27 volume growth was 6.72% year on year and revenue rose 11% to Rs 370.5 crore from Rs 334.7 crore. Unlike Q2, the six-month period combined higher ticket measures with positive SSG of 0.88%.
How did Cantabil’s Q2 profit growth compare with sales growth?
Cantabil’s Q2 FY27 revenue grew faster than its reported earnings measures: revenue rose 9% to Rs 191.7 crore, earnings before interest, tax, depreciation and amortisation, or EBITDA, rose 5% to Rs 44.4 crore, and profit after tax, or PAT, rose 4% to Rs 7.0 crore. EBITDA margin was 23.2%, compared with 23.9% in Q2 FY26.
Employee expenses increased to Rs 46.8 crore in Q2 FY27 from Rs 39.5 crore in Q2 FY26, other expenses rose to Rs 44.3 crore from Rs 39.2 crore, and depreciation increased to Rs 30.0 crore from Rs 23.9 crore. Finance cost declined to Rs 9.1 crore from Rs 11.2 crore. Cantabil reported profit-before-tax margin of 4.7%, versus 4.8%, and PAT margin of 3.7%, versus 3.8%.
The H1 FY27 comparison was different at the EBITDA level. Revenue increased 11% to Rs 370.5 crore, EBITDA increased 14% to Rs 103.8 crore and EBITDA margin rose to 28.0% from 27.2% in H1 FY26. PAT rose 9% to Rs 23.4 crore from Rs 21.4 crore, while PAT margin declined to 6.3% from 6.4%.
Conclusion
Cantabil’s Q2 FY27 operating data combine network expansion with lower quarterly comparable-store and space-productivity measures. The company added 23 net stores, expanded retail area by 1.25 lakh sq. ft year on year and lifted revenue by 9% to Rs 191.7 crore, while SSG was minus 2.03% and PSF declined by Rs 29 to Rs 608. Higher ABV, ASP and volume were reported alongside these changes.
The unresolved matter is what caused the Q2 productivity decline and whether it will reverse, because the presentation gives no explanation, remediation plan or store-opening target. The next company update can be assessed through disclosed SSG, PSF, net store additions and retail area after the H1 FY27 readings of 0.88%, Rs 609, 38 stores and 9.89 lakh sq. ft, respectively.