










Century Ply debt rises to Rs 1,771 crore as leverage eases
Key highlights
- Century Ply’s total debt increased to Rs 1,771.38 crore in Q2 FY 2026-27 from Rs 1,644.21 crore in Q1.
- Century Ply’s total debt-to-EBITDA ratio improved to 2.08 times in Q2 from 2.20 times in Q1.
- Century Ply’s Q2 EBITDA rose 15.9% quarter on quarter to Rs 231.83 crore.
- Century Ply’s cash-conversion cycle shortened to 67.87 days in Q2 from 68.86 days in Q1.
powered by IRIS
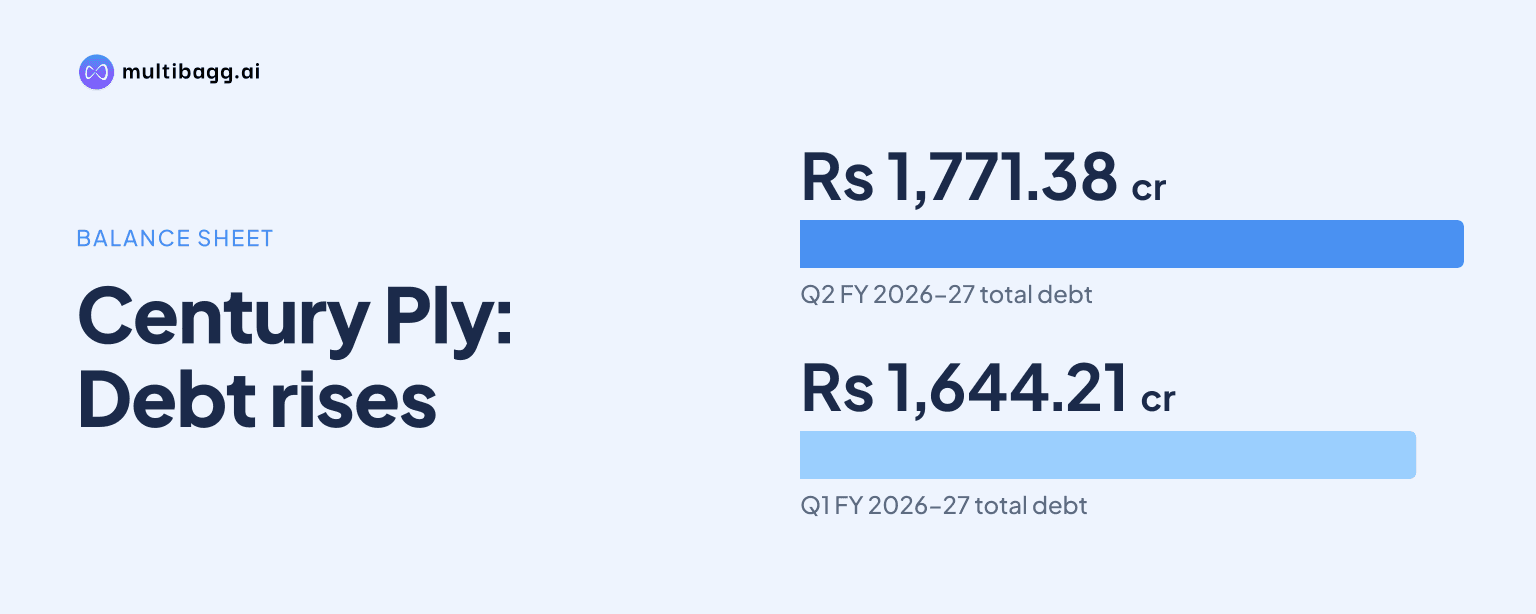
Century Ply reported total debt of Rs 1,771.38 crore in Q2 FY 2026-27, up Rs 127.17 crore from Q1, while total debt-to-EBITDA improved to 2.08 times from 2.20 times as quarterly EBITDA rose 15.9% to Rs 231.83 crore. Fixed assets also rose to Rs 2,957.11 crore and the cash-conversion cycle shortened to 67.87 days.
Know Century Plyboards (India) inside out
Results, valuation, peers and who's buying, in one view.
Why did Century Ply’s total debt increase in Q2 FY 2026-27?
Century Ply’s total debt increased to Rs 1,771.38 crore in Q2 FY 2026-27 from Rs 1,644.21 crore in Q1 FY 2026-27. Long-term Indian-rupee debt excluding current maturities rose by Rs 189.30 crore to Rs 690.61 crore, while long-term Indian-rupee debt increased by Rs 45.63 crore to Rs 144.22 crore.
Capex buyers’ credit increased by Rs 6.94 crore to Rs 239.46 crore, while short-term debt from banks fell by Rs 114.71 crore to Rs 697.08 crore. Century Ply classifies buyers’ credit as payments to import vendors and presents it within current liabilities for analytical purposes.
Century Ply’s debt has risen over the periods in its presentation, from Rs 239.07 crore in 2022-23 to Rs 1,383.12 crore in 2024-25 and Rs 1,531.26 crore in 2025-26. The presentation does not allocate individual debt facilities to specific projects, so it does not establish the use of proceeds for each borrowing category.
How did Century Ply’s leverage improve despite higher debt?
Century Ply’s total debt-to-EBITDA ratio improved to 2.08 times in Q2 FY 2026-27 from 2.20 times in Q1, despite the increase in debt. The ratio was 2.47 times in 2025-26 and 2.97 times in 2024-25, placing the Q2 figure below both recent full-year readings.
EBITDA, or earnings before interest, tax, depreciation and amortisation, rose to Rs 231.83 crore in Quarter Sep’26 from Rs 199.95 crore in Quarter June’26 and Rs 176.57 crore in Quarter Sep’25. EBITDA margin increased to 13.0% from 12.8% sequentially, while total income rose 14.0% quarter on quarter to Rs 1,780.04 crore.
Interest cover increased to 5.16 times in Q2 from 4.93 times in Q1, but total debt-to-equity rose to 0.69 from 0.65. Shareholders’ equity increased by Rs 81.76 crore to Rs 2,795.08 crore, whereas total debt rose by Rs 127.17 crore.
Total borrowing cost was Rs 33.94 crore in Quarter Sep’26, compared with Rs 29.56 crore in Quarter June’26 and Rs 31.09 crore in Quarter Sep’25. Interest expense alone rose to Rs 31.25 crore from Rs 28.09 crore sequentially, meaning the leverage-ratio improvement occurred alongside a higher quarterly interest charge.
What changed in Century Ply’s assets and liabilities?
Century Ply’s fixed assets increased by Rs 147.71 crore sequentially to Rs 2,957.11 crore in Q2 FY 2026-27. Capital work in progress rose by Rs 50.15 crore to Rs 283.89 crore, taking the combined increase in these two asset categories to Rs 197.86 crore.
Total assets increased by Rs 238.28 crore to Rs 4,776.96 crore, while non-current liabilities rose to Rs 210.51 crore from Rs 181.15 crore. The presentation shows total assets and total liabilities at the same Rs 4,776.96 crore, with shareholders’ equity included on the liabilities side.
Net current assets increased to Rs 1,335.01 crore from Rs 1,280.00 crore. Sundry debtors rose by Rs 109.33 crore to Rs 787.22 crore and finished-goods inventory increased by Rs 36.81 crore to Rs 497.18 crore, while raw-material inventory fell by Rs 5.58 crore to Rs 662.37 crore.
Cash, bank and liquid funds were Rs 83.57 crore in Q2, compared with Rs 82.32 crore in Q1. Sundry creditors fell by Rs 49.74 crore to Rs 465.11 crore, buyers’ credit rose by Rs 44.67 crore to Rs 157.77 crore, and other current liabilities declined by Rs 15.74 crore to Rs 286.95 crore.
Got a follow-up? Ask IRIS
Did Century Ply’s working-capital cycle improve in Q2?
Century Ply’s cash-conversion cycle improved to 67.87 days in Q2 FY 2026-27 from 68.86 days in Q1, a reduction of 0.99 day. It was also below 81.19 days in 2025-26 and 83.74 days in 2024-25.
The presentation calculates the cycle as annualised debtor days plus raw-material inventory days plus finished-goods inventory days, minus annualised payables days. Raw-material inventory days fell by 5.09 days to 33.95 and finished-goods inventory days declined by 1.41 days to 25.49.
Annualised debtor days increased to 40.35 from 39.62, while annualised payables days declined to 31.93 from 36.70. Total payables, comprising trade payables and buyers’ credit for raw materials, decreased by Rs 5.06 crore to Rs 622.89 crore.
Q2 net sales for the period increased to Rs 1,780.04 crore from Rs 1,561.38 crore in Q1. The combination of higher sales and lower annualised inventory days shortened the reported cycle even as debtors and finished-goods inventory increased in rupee terms.
What does Century Ply’s FY 2026-27 guidance indicate?
Century Ply management guides for more than 25% revenue growth in plywood, more than 20% in laminates, 16% to 18% in medium-density fibreboard, or MDF, more than 100% in particle board, and more than 65% in logistics for FY 2026-27. Management also guides for double-digit EBITDA margins in MDF and particle board by year-end.
In Q2, plywood revenue grew 28.6% year on year, laminates grew 20.6%, MDF grew 10.5%, particle board grew 211.0%, and logistics grew 72.7%. EBITDA margins excluding foreign-exchange losses were 15.7% for plywood, 11.6% for laminates, 8.9% for MDF, 7.4% for particle board and 25.5% for logistics.
Fixed-assets turnover improved to 2.20 times in Q2 from 2.05 times in Q1. At the same time, the long-term debt including capex buyers’ credit-to-equity ratio increased to 0.38 from 0.31, providing a further balance-sheet measure alongside the debt-to-EBITDA ratio.
Conclusion
Century Ply entered Q2 FY 2026-27 with a higher debt balance and a changed borrowing mix, as increased long-term Indian-rupee debt outweighed lower short-term bank borrowing. Higher EBITDA reduced reported debt-to-EBITDA, while interest cover improved, and rising fixed assets, capital work in progress and sales coincided with a modestly shorter cash-conversion cycle.
Next, investors can track management’s FY 2026-27 revenue guidance and its target of double-digit EBITDA margins in MDF and particle board by year-end. Subsequent disclosures will show whether fixed-assets turnover extends beyond 2.20 times and whether debt, borrowing costs and working-capital needs continue to move in line with operating growth.