










CITIUS TransNet declares ₹2.9585 Q2 payout after ₹340 crore cash flow
Key highlights
- CITIUS declared a Q2 FY27 distribution of ₹2.9585 per unit, equal to ₹180.4685 crore.
- CITIUS showed ₹340 crore of cash flow from ₹975 crore of H1 FY27 receipts.
- CITIUS reported H1 FY27 revenue of ₹1,084 crore, compared with ₹1,000 crore in H1 FY26.
- CITIUS had ₹4,422 crore of gross borrowings and net debt equal to 33.85% of adjusted assets under management at September 30, 2026.
powered by IRIS
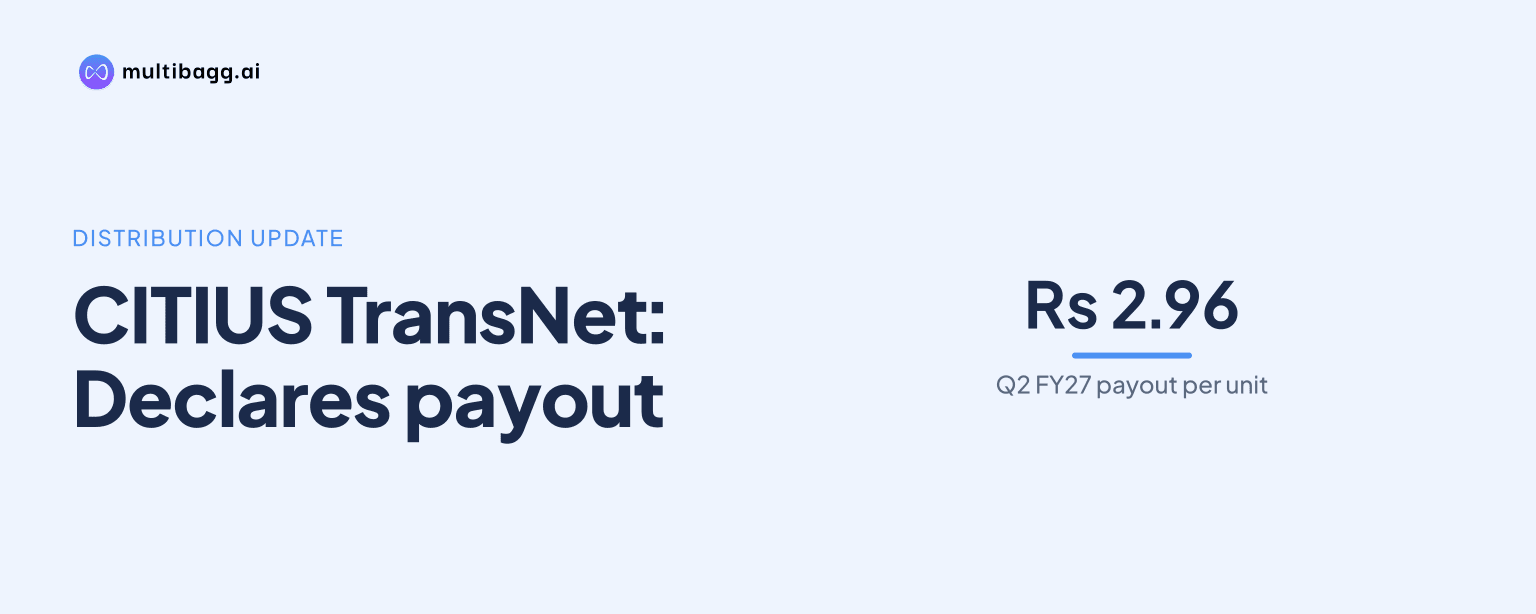
CITIUS TransNet declared ₹2.9585 per unit for Q2 FY27, equal to ₹180.4685 crore, after its May 1 to September 30, 2026 waterfall showed ₹340 crore of cash flow before ₹34 crore of retention. The bridge starts with ₹975 crore of receipts and deducts ₹636 crore of operating, authority, debt-servicing and other outflows.
Know Citius Transnet Investment Trust inside out
Results, valuation, peers and who's buying, in one view.
How did CITIUS fund the Q2 FY27 distribution?
CITIUS linked its declared Q2 FY27 distribution of ₹180.4685 crore to a first-half FY27 waterfall showing ₹340 crore of cash flow and ₹306 crore of displayed total distributions after ₹34 crore of retention. The Q2 distribution was ₹2.9585 per unit, compared with an actual Q1 FY27 distribution of ₹125.8430 crore, or ₹2.0600 per unit.
The two quarterly distributions total ₹5.0185 per unit, matching the cumulative distribution per unit in CITIUS's financial highlights. CITIUS also presented a proposed FY27 distribution of ₹9.50 per unit, although the presentation does not set out a quarterly timetable or conditions for achieving that full-year amount.
The Q2 distribution comprised ₹1.7560 per unit of interest, ₹0.4885 of capital repayment, ₹0.6943 of dividend and ₹0.0197 of other components. Interest was the largest stated component, representing more than the dividend and capital-repayment amounts individually.
What were CITIUS's H1 FY27 receipts and outflows?
CITIUS recorded ₹975 crore of total income and receipts in H1 FY27, comprising ₹811 crore of toll receipts, ₹112 crore of annuity receipts and ₹52 crore of treasury and other income. For this waterfall, H1 FY27 covers May 1, 2026 to September 30, 2026, rather than the April-to-September period used for the revenue comparison elsewhere in the presentation.
Toll receipts were the main cash source, at more than seven times the ₹112 crore received from annuities. The toll contribution also exceeded the combined ₹164 crore from annuities, treasury income and other income, showing that the displayed cash bridge was chiefly supported by toll collections.
CITIUS reported ₹636 crore of deductions before the ₹340 crore cash-flow measure. Debt servicing was the largest outflow at ₹255 crore, followed by authority payments of ₹168 crore and operating expenses of ₹153 crore; the remaining deductions were ₹39 crore of expenses labelled MM in the presentation and ₹21 crore of other items.
Got a follow-up? Ask IRIS
How did CITIUS's operating collections change in FY27?
CITIUS reported total revenue of ₹1,084 crore in H1 FY27, up from ₹1,000 crore in H1 FY26, an increase of ₹84 crore. Q2 FY27 revenue was ₹555 crore against ₹502 crore in Q2 FY26, while the presentation defines revenue as gross toll collections and or annuities received, excluding goods and services tax.
The H1 FY27 revenue increase coincided with 7.5% traffic growth against H1 FY26, and Q2 FY27 toll revenue was ₹483 crore. In FY26, CITIUS reported ₹1,883 crore of toll revenue and ₹336 crore of annuity revenue within ₹2,219 crore of total revenue, indicating that tolls were the larger reported revenue stream.
Portfolio passenger-car-unit traffic, a measure of traffic volume, grew 9.8% year on year in Q2 FY27 and 7.1% for the trailing 12 months to September 2026. SRTPL posted the highest listed Q2 growth at 15.6%, while SBGTPL grew 0.3%; CITIUS attributed SBGTPL's outcome to geopolitical conditions, reduced Middle East export-import volumes, port congestion and logistical challenges.
The portfolio traffic figures are weighted by tollable lengths at individual toll plazas and by assets under management as of September 30, 2026. They are therefore not simple averages of the seven asset-level growth rates shown in the presentation.
What was CITIUS's debt and valuation position at September 2026?
CITIUS reported ₹4,422 crore of gross borrowings and net debt equal to 33.85% of adjusted assets under management as of September 30, 2026. Adjusted assets under management were ₹11,147 crore, while the average borrowing cost was 7.65% on the same date.
The repayment profile allocates 28% of debt repayments up to FY30, 44% to FY31 through FY35 and 28% beyond FY35. The ₹255 crore debt-servicing deduction in the H1 FY27 waterfall provides the reported period's cash-flow context for that borrowing profile.
CITIUS displayed a trust credit rating of AAA/Stable from Crisil and India Ratings and a sponsor credit rating of AA/Stable from ICRA and India Ratings. It also reported net asset value of ₹113.08 per unit for the period ended September 30, 2026, alongside ₹890 crore of cash and cash equivalents across special-purpose vehicles, holding companies and the trust, excluding certain earmarked funds.
The independent valuation showed adjusted portfolio enterprise value of ₹11,147 crore at September 30, 2026, down from ₹11,968 crore at March 31, 2026. The presentation states that the September valuation used toll-asset weighted average revenue growth assumptions of 8.8% from FY26 to end of life and traffic growth assumptions of 4.6%.
Conclusion
CITIUS converted ₹975 crore of receipts in its May-to-September H1 FY27 waterfall into ₹340 crore of cash flow after ₹636 crore of outflows, then retained ₹34 crore and displayed ₹306 crore of total distributions. The Q2 declaration of ₹2.9585 per unit exceeded Q1's ₹2.0600 per unit, while H1 revenue increased by ₹84 crore year on year and traffic grew 7.5%.
The next disclosed milestones are CITIUS's proposed FY27 distribution of ₹9.50 per unit and the annuity schedule, including Dibang's ₹39.7 crore Q3 payment shown as due on November 13. Investors can also monitor whether the 44% repayment share scheduled for FY31 to FY35 changes and whether the traffic gap between SRTPL's 15.6% Q2 growth and SBGTPL's 0.3% growth persists.