










Citius TransNet Q2 traffic growth reaches 9.8% despite SBGTPL
Key highlights
- Citius’s toll portfolio recorded 9.8% PCU traffic growth in Q2 FY27.
- SRTPL led Q2 FY27 traffic growth at 15.6%, followed by DTPL at 12.4%.
- SBGTPL grew 0.3% in Q2 FY27 as Middle East EXIM disruption and port congestion affected traffic.
- Citius reported approximately Rs 1,084 crore of total revenue in H1 FY27, versus approximately Rs 1,000 crore in H1 FY26.
powered by IRIS
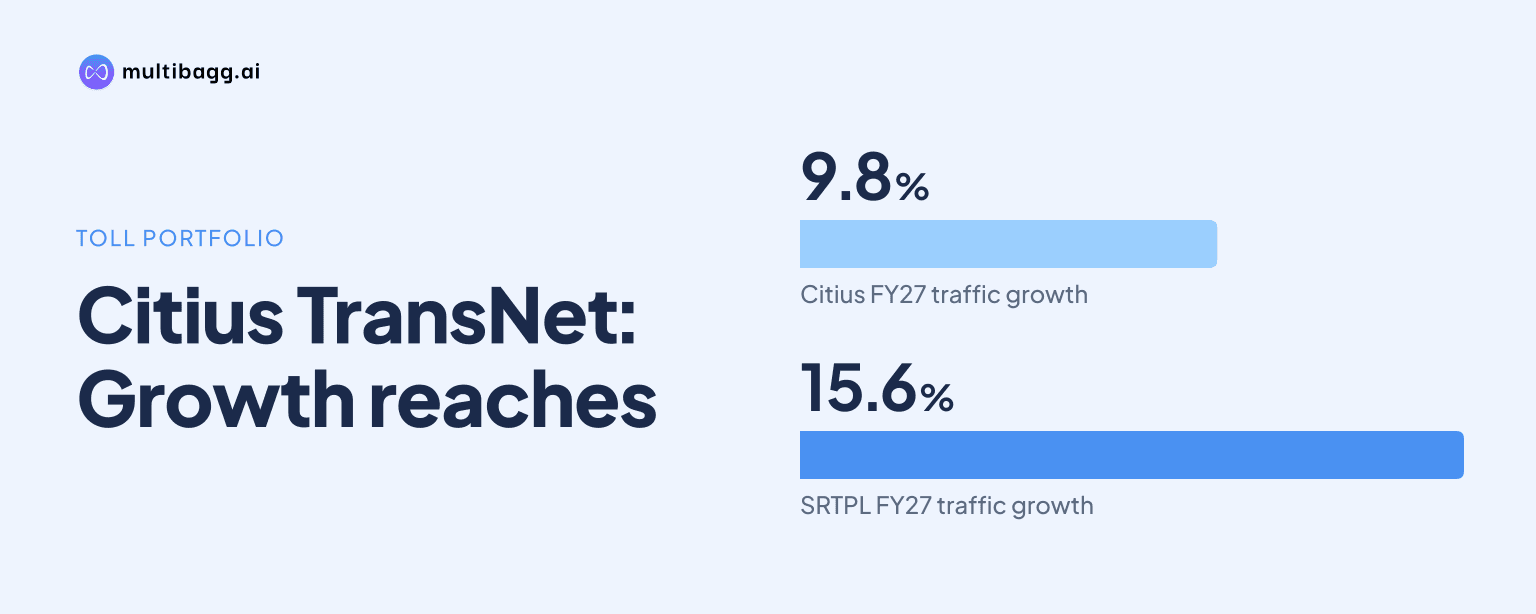
Citius TransNet recorded 9.8% year-on-year traffic growth in Q2 FY27, led by 15.6% growth at SRTPL and 12.4% at DTPL, while SBGTPL grew only 0.3% as reduced Middle East EXIM volumes, port congestion and stranded shipments affected traffic.
Know Citius Transnet Investment Trust inside out
Results, valuation, peers and who's buying, in one view.
How fast did Citius traffic grow in Q2 FY27?
Citius’s toll-asset portfolio traffic, measured in passenger car units (PCU), increased 9.8% year on year in Q2 FY27, compared with 7.1% for the trailing 12 months (TTM) ended September 2026. The Q2 comparison covers July 1, 2026 to September 30, 2026, against Q2 FY26.
The 9.8% quarterly increase was above the 5.4% traffic growth reported for FY26 versus FY25. From FY23 to FY26, Citius reported weighted-average traffic growth of 6.6%, while toll revenue grew at an average annualised rate of 10.2%, putting the Q2 FY27 PCU result above both prior benchmarks.
Which Citius assets drove Q2 traffic growth?
Citius’s Q2 traffic growth rate was led by SRTPL at 15.6%, followed by DTPL at 12.4% and RVTPL at 8.6%. PECPL grew 7.4%, TEL grew 7.3% and AMTPL grew 6.1%, meaning six of the seven listed toll assets recorded growth above 6% in Q2 FY27.
The TTM comparison shows that SRTPL’s Q2 growth rate was 6.3 percentage points above its 9.3% TTM rate, while DTPL’s 12.4% Q2 result was 4.0 percentage points above its 8.4% TTM growth. TEL grew 7.3% in Q2 FY27 against 3.1% for the TTM period, whereas RVTPL’s 8.6% Q2 growth was below its 11.2% TTM rate.
Citius calculates portfolio traffic growth as a weighted average of PCU growth at the relevant special purpose vehicles (SPVs). The calculation uses tollable road lengths for individual toll plazas and asset-under-management weights as of September 30, 2026, so the 9.8% portfolio rate is not a simple average of the seven asset-level results.
Why did SBGTPL traffic almost stall?
SBGTPL’s PCU traffic increased only 0.3% year on year in Q2 FY27 because Citius said ongoing geopolitical conditions reduced export-import (EXIM) volumes to the Middle East. The presentation also cited port congestion following stranded shipments and resulting logistical challenges.
The weakness extended beyond one quarter, with SBGTPL reporting 0.9% growth in the TTM ended September 2026, the lowest rate among the seven listed toll assets. The portfolio’s TTM growth was 7.1%, and every other listed asset recorded at least 3.1% growth during that period.
SBGTPL is a Gujarat asset on National Highway 8A in Citius’s portfolio. The presentation attributes the slowdown to trade and logistics conditions, but does not quantify the reduction in Middle East-linked volumes, the duration of the disruption or the share of SBGTPL traffic exposed to EXIM flows.
Got a follow-up? Ask IRIS
How does Q2 traffic fit Citius’s revenue profile?
Citius reported Rs 483 crore of toll revenue in Q2 FY27 and approximately Rs 555 crore of total revenue, compared with approximately Rs 502 crore of total revenue in Q2 FY26. The presentation defines revenue as gross toll collection and annuities received, excluding goods and services tax (GST).
For H1 FY27, total revenue was approximately Rs 1,084 crore, up from approximately Rs 1,000 crore in H1 FY26. The Rs 84 crore increase accompanied reported portfolio traffic growth of 7.5% for H1 FY27 versus H1 FY26.
Citius reported FY26 toll revenue of Rs 1,883 crore, annuity revenue of Rs 336 crore and total revenue of Rs 2,219 crore. Its FY26 mix was 85:15 between toll and annuity receipts, while commercial vehicles represented 77% of toll revenue and 63% of PCU, compared with 23% and 37%, respectively, for passenger vehicles.
What operating indicators frame Citius’s traffic performance?
Citius operated 10 roads across nine states, covering about 3,406 lane-kilometres, as of September 30, 2026. Its toll assets had an average operating history of 10.9 years and an average residual life of 12.4 years.
About 70% of Citius’s toll revenue came from the five states with the highest FY26 GST collections. The portfolio reported a 98% FASTag toll-collection rate in FY26; the calculation excluded SRPTL, where FASTag was effectively implemented from January 2025 and the FY26 collection rate was 86%.
Citius also disclosed a right of first offer (ROFO) agreement for 11 hybrid annuity model (HAM) assets with National Highways Authority of India concessions. The presentation does not disclose a timetable, valuation or completion certainty for any transfer, while its existing annuity assets have Ministry of Road Transport and Highways or National Highways and Infrastructure Development Corporation counterparties under a tripartite arrangement.
Conclusion
Citius’s Q2 FY27 traffic growth was broad-based, with six of seven listed toll assets recording growth above 6% and the portfolio reaching 9.8%. SRTPL and DTPL posted the highest growth rates, while SBGTPL diverged sharply at 0.3% as Middle East trade disruption and port conditions affected logistics.
The next disclosed matters to watch are whether SBGTPL’s EXIM and port-related constraints ease after its 0.9% TTM growth through September 2026, Citius’s proposed FY27 distribution of Rs 9.50 per unit, and any further details on the 11 ROFO HAM assets.