










DevX draws 85% of Q2 FY27 revenue from Gujarat markets
Key highlights
- DevX generated 85% of its Rs 80.2 crore Q2 FY27 revenue from Gujarat.
- Tier II markets contributed 90% of DevX’s Q2 FY27 revenue, compared with 83% in H1 FY27.
- Managed Space represented 51% of Q2 FY27 revenue, while Design & Build represented 29%.
- DevX reported 15,872 occupied seats and 91.2% occupancy in Q2 FY27.
powered by IRIS
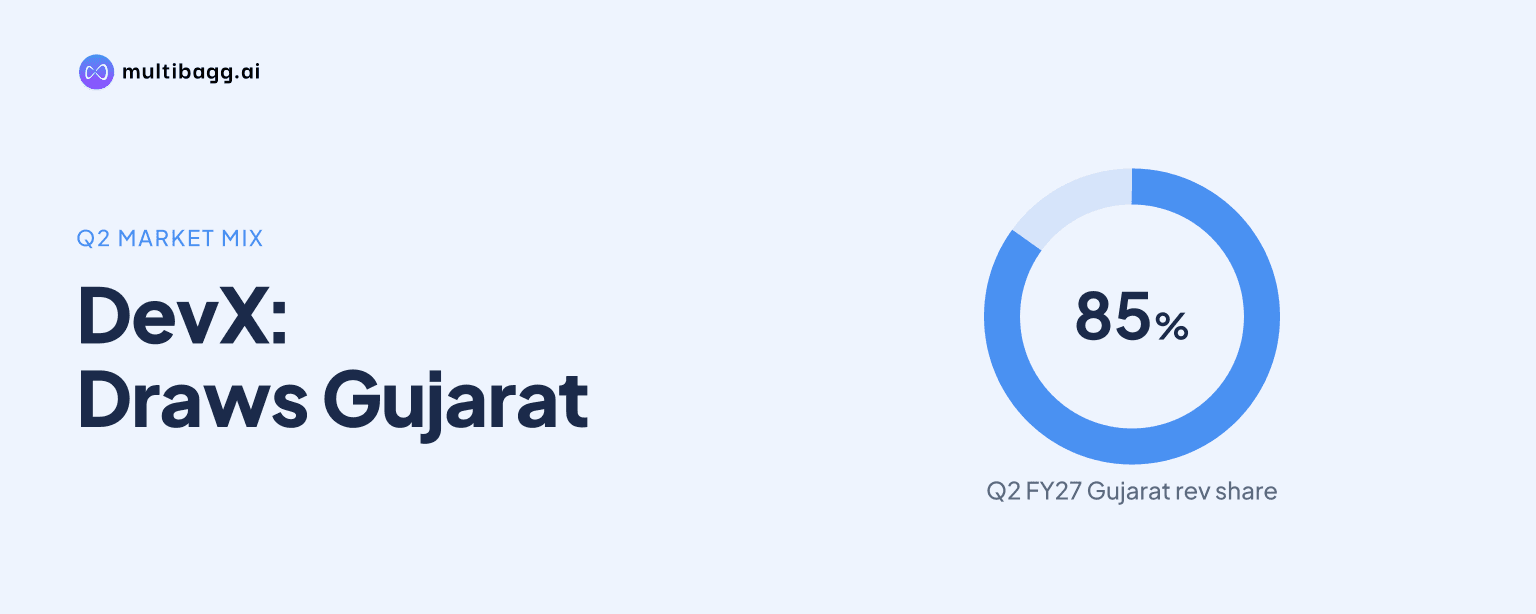
DevX drew 85% of its Rs 80.2 crore Q2 FY27 revenue from Gujarat and 90% from Tier II markets, compared with 77% and 83%, respectively, for H1 FY27. Q2 FY27 refers to the second quarter of financial year 2027. The quarterly data show higher concentration despite DevX reporting operations across 12 cities and 28 managed office centres.
Know Dev Accelerator inside out
Results, valuation, peers and who's buying, in one view.
How concentrated was DevX’s Q2 FY27 revenue by state?
DevX’s Q2 FY27 revenue was concentrated in Gujarat, which accounted for 85% of the Rs 80.2 crore quarterly total. Maharashtra was the next-largest disclosed contributor at 5%, followed by Telangana at 4% and Rajasthan at 3%. Uttar Pradesh and Madhya Pradesh each contributed 1%, taking the disclosed state shares to 99% because of rounding.
Gujarat’s 85% contribution was larger than the combined 14% disclosed for the other five states in Q2 FY27. DevX operated in 12 cities and managed 28 office centres in the quarter, but the presentation does not provide revenue by individual city. It therefore does not identify the Gujarat locations responsible for the reported revenue share.
How did DevX’s Gujarat and Tier II exposure change in H1 FY27?
DevX’s Gujarat share was 85% in Q2 FY27 versus 77% for H1 FY27, while Tier II markets represented 90% in Q2 versus 83% in H1. The comparison shows that the second-quarter revenue mix carried a greater Gujarat and Tier II weighting than the first-half mix. DevX reported Rs 80.2 crore of revenue in Q2 FY27 and Rs 134.0 crore in H1 FY27.
The shares of other disclosed states were lower in Q2 than in H1 FY27 for Maharashtra, Telangana, Rajasthan and Uttar Pradesh. Maharashtra fell to 5% from 9%, Telangana to 4% from 6%, Rajasthan to 3% from 5%, and Uttar Pradesh to 1% from 2%; Madhya Pradesh remained at 1%. These are percentage-share comparisons, as DevX did not disclose state-level revenue amounts.
Tier I markets accounted for 10% of Q2 FY27 revenue, down from 17% in H1 FY27. DevX’s industry material identifies Ahmedabad and Jaipur as high-growth flexible-office markets, each with estimated 2026 flexible stock of at least 1.5 million square feet. The presentation does not disclose a DevX target for future Gujarat, Tier I or Tier II revenue shares.
Which segments produced DevX’s Q2 FY27 revenue?
Managed Space was DevX’s largest Q2 FY27 revenue segment at 51%, followed by Design & Build at 29%. Facility Management Services contributed 9%, while information technology and information technology-enabled services, or IT and ITES, and Co-Working Space each contributed 5%. Payroll Management Services represented 1% of the Rs 80.2 crore quarterly total.
The Q2 mix differed from H1 FY27, when Managed Space Services contributed 57% of Rs 134.0 crore and Designing & Execution contributed 24%. Co-Working Space was 6%, IT and ITES Services 5%, Payroll Management Services 1%, and Facility Management and Other Services 6%. Managed Space’s contribution was therefore six percentage points lower in Q2 than in H1, while Design & Build’s was five points higher.
DevX classifies Managed Space Services, Co-Working Space, Payroll Management Services and Facility Management Services as Core Workspace. The presentation identifies Neddle & Thread as its designing and execution operation, while SaaSJoy provides IT and ITES services. A separate Q2 FY27 platform slide grouped Managed Office Space plus Development Management at 66%, Design & Build at 29%, and global capability centre, or GCC, services at 5%, using categories that differ from the six-segment contribution table.
Got a follow-up? Ask IRIS
What does DevX’s customer and seat mix show?
DevX had 376 Core Workspace customers in Q2 FY27, and 78% were located in Gujarat. Maharashtra accounted for 11% of customers and Rajasthan for 7%, while Madhya Pradesh represented 2% and Uttar Pradesh and Telangana each represented 1%. Gujarat’s customer share was below its 85% share of DevX’s total Q2 FY27 revenue.
Gujarat accounted for 72% of DevX’s 15,872 occupied seats in Q2 FY27, compared with 11% each for Maharashtra and 6% for Telangana. Rajasthan represented 5% of occupied seats, Uttar Pradesh 4%, and Madhya Pradesh 2%. The 72% seat share was also below Gujarat’s 85% revenue share, but the presentation does not state why revenue and seat distributions differed.
Information technology and ITES made up 49% of the 376 Core Workspace customers and 54% of occupied seats. Consulting Services represented 25% of customers but 32% of seats, while Real Estate accounted for 12% of customers and 4% of seats. Co-Working Space users represented 77% of customers and 88% of occupied seats, compared with Managed Space at 23% of customers and 12% of seats.
DevX reported 17,412 operational seats and 91.2% occupancy in Q2 FY27, compared with 13,604 operational seats and 88.3% occupancy in Q2 FY26. Occupied seats increased to 15,872 from 12,019 over the same comparison. Mature-centre occupancy rose to 81.0% from 61.8%, while DevX defines mature centres as office centres operating at 100% occupancy.
Conclusion
DevX’s Q2 FY27 disclosures show a revenue base led by Managed Space but concentrated in Gujarat and Tier II markets. Gujarat supplied 85% of quarterly revenue, above its 77% H1 FY27 contribution, while Tier II markets supplied 90%, compared with 83% in H1. Customer and occupied-seat data also show a Gujarat-led workspace base, although their Gujarat shares were lower than the state’s revenue share.
The key unresolved matter is whether DevX’s 12-city and 28-centre network will produce a different geographic mix, as the presentation gives neither a state-diversification target nor a related expansion schedule. Subsequent disclosures can show whether the Tier I share moves from 10%, whether Gujarat’s revenue share changes from 85%, and how the 91.2% Q2 FY27 occupancy level develops.