










DevX mature-centre occupancy reaches 81% as footprint expands
Key highlights
- DevX reported mature-centre occupancy of 81.0% in Q2 FY27, up from 61.8% in Q2 FY26.
- DevX total super built-up area reached 1.16 million square feet in Q2 FY27, versus 0.89 million square feet a year earlier.
- DevX had 15,872 occupied seats and 17,412 operational seats in Q2 FY27, resulting in 91.2% overall occupancy.
- DevX reported a revenue-to-rent ratio of 2.90 times in Q2 FY27, compared with 2.40 times in Q2 FY26.
powered by IRIS
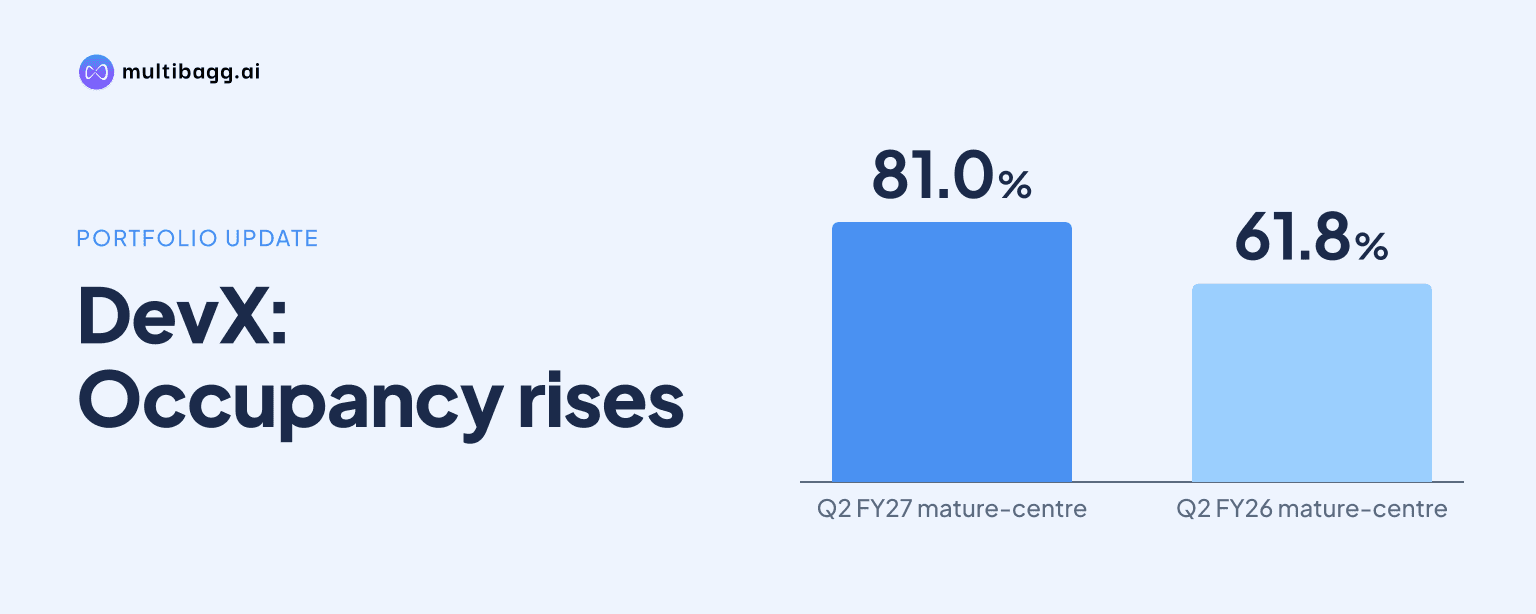
DevX lifted mature-centre occupancy to 81.0% in Q2 FY27 from 61.8% a year earlier as total super built-up area reached 1.16 million square feet, up from 0.89 million square feet. The portfolio had 15,872 occupied seats across 17,412 operational seats and 28 managed office centres.
Know Dev Accelerator inside out
Results, valuation, peers and who's buying, in one view.
How much did DevX's workspace footprint expand?
DevX increased total super built-up area (SBA) by 0.27 million square feet year on year to 1.16 million square feet in Q2 FY27, from 0.89 million square feet in Q2 FY26. The Q2 FY27 area was also 0.03 million square feet above the 1.13 million square feet reported in Q1 FY27, while FY26 SBA was 0.83 million square feet.
Growth was more pronounced in the area classified as mature centres. Mature-centre SBA reached 0.94 million square feet in Q2 FY27, compared with 0.55 million square feet in Q2 FY26 and 0.79 million square feet in Q1 FY27. The 0.39 million-square-foot year-on-year increase in mature-centre SBA exceeded the 0.27 million-square-foot increase in total SBA.
DevX operated in 12 cities in each of the three reported periods, so the increase to 1.16 million square feet did not coincide with a reported change in city count. The managed-centre count returned to 28 in Q2 FY27 from 27 in Q1 FY27 and matched the Q2 FY26 count; the Chairman’s message also says the operating portfolio served 376 clients.
How did DevX's overall occupancy change in Q2 FY27?
DevX reported overall occupancy of 91.2% in Q2 FY27, up 2.9 percentage points from 88.3% in Q2 FY26 as its seat base expanded. Occupied seats increased by 3,853 to 15,872, while operational seats increased by 3,808 to 17,412 from 13,604 a year earlier.
The sequential movement differed from the year-on-year comparison. Occupancy eased to 91.2% in Q2 FY27 from 91.9% in Q1 FY27, as operational seats rose by 118 from 17,294 and occupied seats declined by 27 from 15,899. Total SBA nevertheless increased by 0.03 million square feet over the same quarter-on-quarter period.
Q2 FY27 occupancy was also above the 90.3% reported for FY26 and the 87.6% reported for FY25. The occupied-seat count of 15,872 exceeded FY26’s 12,019, while operational seats were 17,412 against 13,304 in FY26, showing that the higher occupancy versus the prior financial year was reported alongside additional capacity.
Got a follow-up? Ask IRIS
What does DevX's 81% mature-centre occupancy mean?
DevX’s reported mature-centre occupancy was 81.0% in Q2 FY27, 19.2 percentage points above 61.8% in Q2 FY26 and 11.2 percentage points above 69.8% in Q1 FY27. This increase was larger than the 2.9-percentage-point year-on-year rise in overall portfolio occupancy, while mature-centre SBA rose to 0.94 million square feet.
The annual data give a different comparison point. Mature-centre occupancy was 70.4% in FY26, 93.1% in FY25 and 95.9% in FY24, placing Q2 FY27 10.6 percentage points above FY26 but 12.1 percentage points below FY25. DevX’s footnote defines mature centres as office centres operating at 100% occupancy, while the presentation separately reports mature-centre occupancy below 100% without explaining the methodology.
Mature-centre SBA represented 0.94 million square feet of DevX’s 1.16 million-square-foot Q2 FY27 portfolio, leaving 0.22 million square feet outside that classification. In Q2 FY26, mature-centre SBA was 0.55 million square feet out of total SBA of 0.89 million square feet, leaving 0.34 million square feet outside the classification. The mature-centre portion of the reported portfolio therefore increased as the network expanded.
Did higher utilisation coincide with better monetisation?
DevX reported a revenue-to-rent ratio of 2.90 times in Q2 FY27, compared with 2.40 times in Q2 FY26 and 2.36 times in Q1 FY27. The company says the measure was previously labelled rent to revenue and that the underlying metric did not change; its Q2 FY27 level also exceeded the 2.28 times reported for FY26.
Enterprise clients accounted for 75% of revenue from operations in Q2 FY27, up from 65% in Q2 FY26 and 70% in Q1 FY27. Brokerage was 1.13% of revenue from operations, versus 1.6% a year earlier and 1.8% in the preceding quarter. These indicators coincided with Q2 FY27 consolidated revenue of Rs 80.2 crore, 54.8% above Rs 51.8 crore in Q2 FY26.
Managed Space was DevX’s largest Q2 FY27 revenue segment, contributing 51% of Rs 80.2 crore, followed by Design & Build at 29%. Facility Management Services contributed 9%, IT-ITes Services and Co-Working Space each contributed 5%, and Payroll Management Services contributed 1%. Gujarat generated 85% of quarterly revenue and Tier 2 markets generated 90%, according to the company’s reported revenue mix.
Conclusion
DevX combined a 0.27 million-square-foot year-on-year expansion in total SBA with a 2.9-percentage-point rise in overall occupancy and a 19.2-percentage-point increase in reported mature-centre occupancy. Occupied seats reached 15,872, the revenue-to-rent ratio reached 2.90 times, and enterprise clients accounted for 75% of revenue from operations in Q2 FY27.
The next measure of progress will be the rollout of DevX’s disclosed pipeline of 17 new centres covering approximately 2.81 million square feet. Management says it plans to commission centres in phases, strengthen leasing, improve utilisation and grow its global capability centre services offering over coming quarters, making new capacity and occupied-seat trends relevant operating markers.