










Dollar Industries Limited net debt rises to Rs 287.7 crore
Key highlights
- Dollar’s net debt was Rs 287.7 crore at 30 September 2026, up from Rs 276.8 crore at 31 March 2026.
- Dollar’s annualised cash-conversion cycle was 157 days at September 2026, versus 154 days at March 2026.
- Short-term borrowings rose to Rs 256.2 crore at September 2026 from Rs 159.8 crore at June 2026.
- Dollar reported annualised ROE of 12.7% and ROCE of 14.4% at September 2026.
powered by IRIS
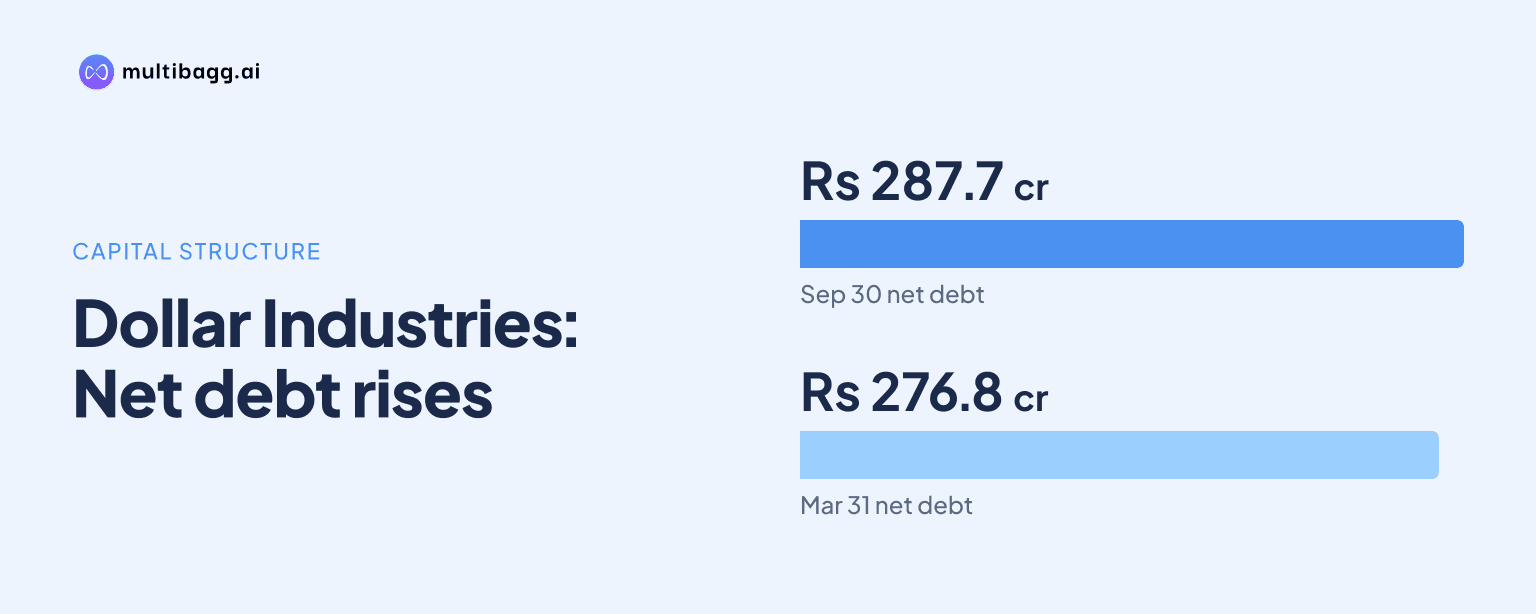
Dollar Industries Limited reported net debt of Rs 287.7 crore at 30 September 2026, Rs 10.9 crore above 31 March 2026, while its annualised cash-conversion cycle was 157 days, three days longer. Receivable days rose by five and inventory days by seven, partly offset by a nine-day increase in payable days.
Know Dollar Industries inside out
Results, valuation, peers and who's buying, in one view.
How did Dollar’s net debt change by September 2026?
Dollar’s net debt increased to Rs 287.7 crore at 30 September 2026 from Rs 276.8 crore at 31 March 2026, after falling to Rs 192.3 crore at 30 June 2026. The September figure was Rs 95.4 crore higher than in June, reversing the reduction recorded at the end of the first quarter of FY27.
The movement came with a change in the borrowing mix. Short-term borrowings rose to Rs 256.2 crore in September from Rs 159.8 crore in June and Rs 243.1 crore in March. Long-term borrowings, however, declined to Rs 31.8 crore from Rs 32.8 crore in June and Rs 33.8 crore in March. Dollar does not disclose its cash balance in the presentation, so the reported net-debt movement cannot be separated between borrowings and cash from this disclosure.
Net debt nevertheless remained below the company’s FY24 and FY25 levels. Dollar reported Rs 304 crore of net debt in FY24 and Rs 329.3 crore in FY25, compared with Rs 276.8 crore in FY26 and Rs 287.7 crore in H1 FY27. The September amount was Rs 16.3 crore below FY24 and Rs 41.6 crore below FY25, although it was Rs 10.9 crore above the FY26 closing balance.
Why did Dollar’s cash-conversion cycle widen to 157 days?
Dollar’s annualised cash-conversion cycle widened to 157 days at 30 September 2026 from 154 days at 31 March 2026 because receivable days increased from 115 to 120 and inventory days rose from 102 to 109. Payable days also increased, from 63 to 72, offsetting nine days of the 12-day combined increase in receivables and inventory.
The cycle had reached 160 days at 30 June 2026, when receivable days were 130, inventory days were 124 and payable days were 94. By September, Dollar had reduced receivable days by 10 and inventory days by 15 from June, but payable days fell by 22. The three-day reduction in the cycle from June still left it three days above the March position.
Dollar calculates the cycle by adding receivable days and inventory days, then deducting payable days. The company bases receivable and inventory days on operating income, while it bases payable days on cost of goods sold, including subcontracting expense. The September figures are annualised, which makes them comparable with the June annualised measures but does not make them a reported full-year result.
Got a follow-up? Ask IRIS
How did leverage and return measures move alongside debt?
Dollar’s net debt-to-equity ratio was 0.29 at 30 September 2026, unchanged from 31 March 2026 after falling to 0.20 at 30 June 2026. Net worth rose by Rs 45.7 crore over the six months, from Rs 954.2 crore in March to Rs 999.9 crore in September, while net debt increased by Rs 10.9 crore.
Net debt to operating earnings before interest, tax, depreciation and amortisation, or EBITDA, was 1.33 in September, compared with 1.39 in March and 1.01 in June. The June and September net debt-to-operating EBITDA ratios are annualised. Dollar’s annualised return on equity, or ROE, rose to 12.7% in September from 11.9% in March, while annualised return on capital employed, or ROCE, rose to 14.4% from 13.4%.
The higher return measures coincided with H1 FY27 operating income of Rs 944.1 crore, up 8.4% year on year, and operating EBITDA of Rs 108.3 crore, up 5.0%. Profit after tax increased 9.4% to Rs 61.8 crore. In Q2 FY27, however, operating EBITDA margin was 11.2%, down from 12.8% a year earlier, while finance cost declined 11.7% year on year to Rs 5.4 crore.
What is Dollar doing that could affect working capital?
Dollar is using Project Lakshya to shift its distribution model from a push system to a replenishment-based model, with the stated aims of improving product planning, inventory management and distributor working capital. The programme had 324 distributors at September 2026, and Lakshya distributors contributed 29% of both value and volume in H1 FY27.
The programme’s retailer base rose to 174,953 enrolled retailers in H1 FY27 from 172,260 in FY26, while active retailers increased to 81,447 from 78,754. Dollar is also implementing an Auto Replenishment System, or ARS, and Distributor Management Systems, or DMS, for Lakshya distributors, alongside ARS at the supply-chain level. These are operational initiatives disclosed by management, not quantified targets for reducing the company’s 157-day cycle.
Dollar’s revenue mix remained concentrated in domestic general trade, which accounted for 85% of H1 FY27 revenue contribution. Quick commerce contributed 5%, while export and e-commerce each contributed 4% and modern trade, including exclusive brand outlets, contributed 2%. The company reported H1 FY27 volume growth of 3.5%, which is relevant to inventory and receivable planning but was not presented as a direct explanation for the September balance-sheet movement.
Conclusion
Dollar ended September 2026 with net debt of Rs 287.7 crore and a 157-day annualised cash-conversion cycle. Debt was higher than the March closing figure and the cycle was three days longer, showing that receivables and inventory continued to absorb more operating capital than at FY26 year-end. Net debt remained below FY24 and FY25 levels, while annualised ROE and ROCE were higher than in March.
The next disclosures should show whether Project Lakshya, ARS and DMS alter receivable, inventory and payable days as the distribution programme expands beyond 324 distributors and 174,953 enrolled retailers. Investors can also track whether the 29% H1 FY27 value contribution from Lakshya distributors changes and whether short-term borrowings remain elevated after reaching Rs 256.2 crore at 30 September 2026.