










Elevate Q2 total income rises 28% as reported PAT falls 24%
Key highlights
- Elevate’s Q2FY27 total income rose 28% year on year to Rs 247.4 crore.
- Elevate’s Q2FY27 reported PAT fell 24% year on year to Rs 33 crore.
- Elevate’s Q2FY27 EBITDA margin declined to 68.5% from 75.3% in Q2FY26.
- Elevate’s net debt decreased by Rs 937.6 crore to Rs 2,404.6 crore between June 30 and September 30.
powered by IRIS
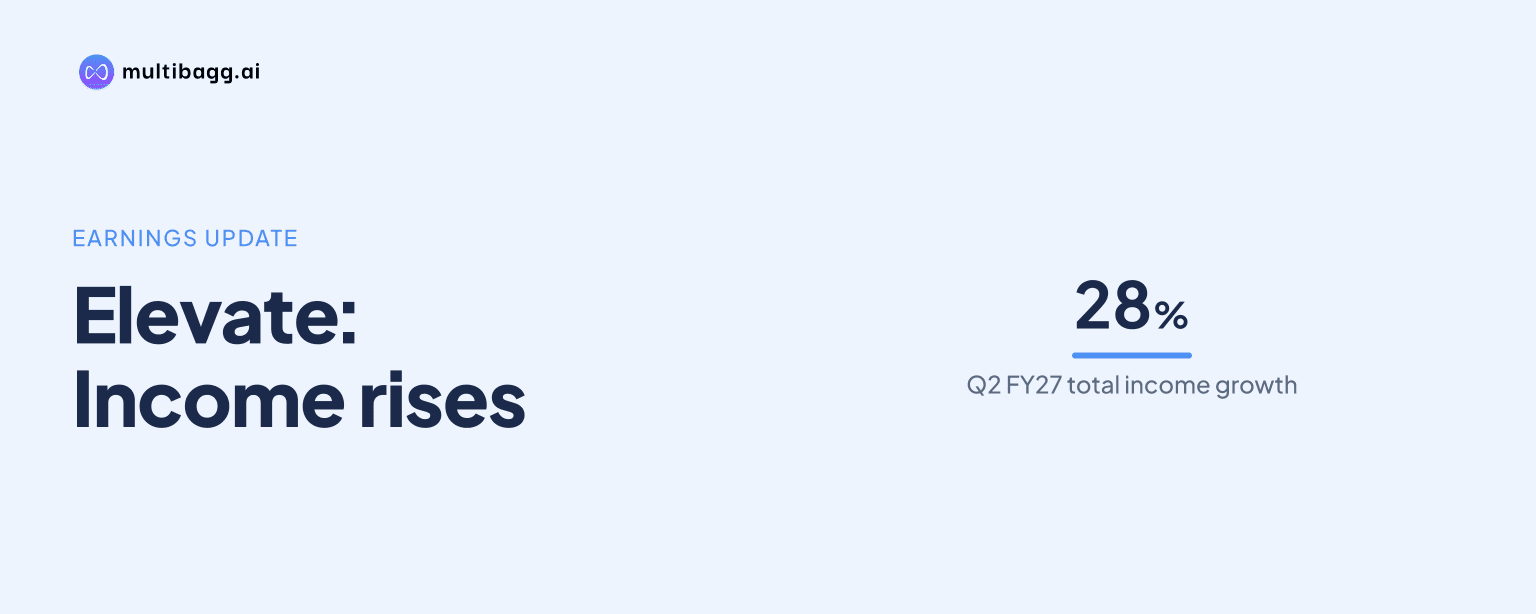
Elevate Campuses reported Q2FY27 total income of Rs 247.4 crore, up 28% year on year, while reported profit after tax fell 24% to Rs 33 crore as EBITDA margin declined and depreciation and finance costs increased. EBITDA rose 16% to Rs 169.6 crore, but finance costs rose Rs 24.1 crore to Rs 86.1 crore.
Know Elevate Campuses inside out
Results, valuation, peers and who's buying, in one view.
Why did Elevate’s Q2FY27 PAT fall despite income growth?
Elevate’s Q2FY27 reported PAT fell because the Rs 23.7 crore increase in EBITDA was outweighed by higher depreciation and finance costs. EBITDA reached Rs 169.6 crore from Rs 145.9 crore a year earlier, while depreciation rose Rs 12 crore to Rs 42.3 crore and finance costs increased Rs 24.1 crore to Rs 86.1 crore. Profit before exceptional items and tax consequently declined 23% to Rs 41.2 crore.
The cost base also expanded alongside income. Employee benefit expenses rose from Rs 10.1 crore in Q2FY26 to Rs 15.1 crore, share-based payments were Rs 6.1 crore against none in the prior-year quarter, and other expenses increased from Rs 37.8 crore to Rs 56.7 crore. Tax declined from Rs 10.5 crore to Rs 8.2 crore, but that did not offset the lower pre-tax profit, leaving PAT at Rs 33 crore versus Rs 43.2 crore.
How did Elevate’s Q2FY27 margin and quarterly performance change?
Elevate’s EBITDA margin fell to 68.5% in Q2FY27 from 75.3% in Q2FY26, a decline of 6.8 percentage points despite the 28% rise in total income. Revenue from operations increased to Rs 236.1 crore from Rs 180.9 crore, while other income decreased to Rs 11.4 crore from Rs 12.9 crore. Higher employee, share-based payment and other expenses limited the conversion of additional income into EBITDA.
Sequentially, Q2FY27 total income was 8% above Q1FY27 total income of Rs 228.1 crore, but EBITDA was 2% lower than Q1FY27 EBITDA of Rs 173.6 crore. The EBITDA margin was 76.1% in Q1FY27, compared with 68.5% in Q2FY27. PAT after exceptional items was Rs 33 crore in Q2FY27, down 3% from Rs 34.1 crore in Q1FY27; the Q1FY27 figure included non-cash impairment and accelerated depreciation on terminated contracts.
What does Elevate’s proforma cash PAT measure?
Elevate presents proforma cash PAT of Rs 78.1 crore for Q2FY27 as an analytical measure calculated from normalised EBITDA, finance cost, potential interest savings from debt repayment and tax. Its calculation starts with normalised EBITDA of Rs 158.4 crore, subtracts reported finance cost of Rs 86.1 crore and tax of Rs 8.2 crore, and adds Rs 14 crore of potential interest savings from debt repayment using allocated IPO proceeds.
This measure differs from reported PAT of Rs 33 crore and is not the statutory profit figure. Elevate says normalised EBITDA primarily excludes Ind AS adjustments related to lease equalisation, finance lease, security deposits and share-based payment expenses. The bridge therefore includes a potential interest saving rather than only items reported in the Q2FY27 profit and loss statement.
Got a follow-up? Ask IRIS
What did Elevate report for the first half of FY27?
Elevate reported H1FY27 total income of Rs 475.5 crore, a 29% increase from Rs 369.9 crore in H1FY26, while PAT before exceptional items declined 10% to Rs 72.3 crore. EBITDA rose 21% to Rs 343.2 crore, but its margin fell to 72.2% from 76.4%. Depreciation increased from Rs 56.4 crore to Rs 83.6 crore and finance costs rose from Rs 127.5 crore to Rs 169.1 crore.
Reported H1FY27 PAT after exceptional items was Rs 67 crore, down 58% from Rs 161.9 crore in H1FY26. The presentation says H1FY27 included non-cash impairment and accelerated depreciation on terminated contracts, with Rs 5.3 crore separating H1 PAT before and after exceptional items. It does not give a corresponding explanation for the difference between H1FY26 PAT before exceptional items of Rs 80.7 crore and PAT after exceptional items of Rs 161.9 crore.
Elevate reported H1FY27 normalised EBITDA of Rs 315.3 crore and proforma cash PAT of Rs 155.9 crore. The latter comprised Rs 77.8 crore in Q1FY27 and Rs 78.1 crore in Q2FY27. That near-even split contrasts with reported PAT after exceptional items of Rs 34.1 crore in Q1FY27 and Rs 33 crore in Q2FY27.
How much did Elevate’s debt decline after the IPO?
Elevate’s net debt fell by Rs 937.6 crore, from Rs 3,342.2 crore on June 30 to Rs 2,404.6 crore on September 30. The presentation attributes the reduction to IPO-led deleveraging. Its cash position was Rs 1,514.1 crore after adjustment for a Rs 1,115.7 crore K-12 acquisition price and Rs 85.8 crore of IPO expenses yet to be incurred.
As of November 11, 2026, Elevate listed rupee-denominated debt of Rs 2,606.3 crore at an average interest rate of 8.9% and AED-denominated debt of Rs 1,312.4 crore at 6.9%, using an exchange rate of Rs 26.13 per AED. It reported proforma net debt to EBITDA of 3.50 times, based on annualised H1FY27 EBITDA, a weighted average loan tenure of nine years and a CareEdge Ratings credit rating and outlook of A/Stable.
Conclusion
Elevate’s Q2FY27 figures show that income growth did not translate into higher reported profit. Total income rose 28% to Rs 247.4 crore and EBITDA rose 16% to Rs 169.6 crore, but the EBITDA margin declined 6.8 percentage points while depreciation and finance costs together increased by Rs 36.1 crore. The same pattern appeared in H1FY27, when EBITDA grew 21% but PAT before exceptional items decreased 10%.
The next disclosed development to watch is Elevate’s proposed addition of 2,450 beds at O.P. Jindal Global University. The transaction has purchase consideration of Rs 1,350 crore payable over nine years in 10 annual instalments, with about 40% payable in the first five instalments; Elevate also cites a 50-year contract tenure and a stabilised yield on cost of about 9.3% on a net-present-value basis.