










FIEM FY26 EBITDA margin rose to 14.18% with nil borrowings
Key highlights
- FIEM’s consolidated EBITDA margin increased to 14.18% in FY26 from 13.39% in FY25.
- FIEM reported consolidated PAT of Rs 255.6 crore in FY26, up from Rs 204.9 crore in FY25.
- FIEM reported nil current and non-current consolidated borrowings at March 31, 2026.
- FIEM’s standalone working-capital days rose to 47 in FY26 from 37 in FY25.
powered by IRIS
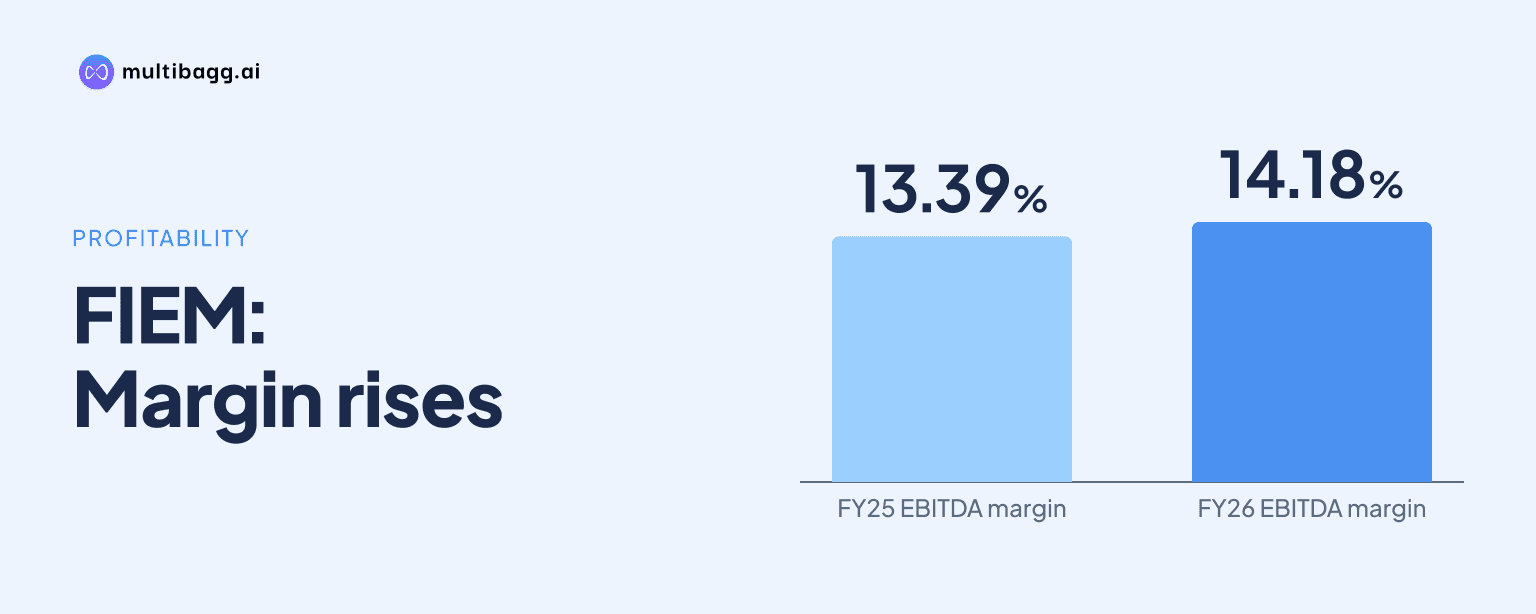
Fiem Industries Limited increased its consolidated EBITDA margin to 14.18% in FY26 from 13.39% in FY25 and reported nil current and non-current borrowings at March 31, 2026. FIEM’s standalone working-capital days, however, rose to 47 from 37 as receivables and inventories increased during FY26.
Know Fiem Industries inside out
Results, valuation, peers and who's buying, in one view.
How did FIEM’s consolidated profitability change in FY26?
FIEM’s consolidated profitability improved in FY26, with sales rising to Rs 2,792.1 crore from Rs 2,405.4 crore and EBITDA, or earnings before interest, tax, depreciation and amortisation, increasing to Rs 395.9 crore from Rs 322.2 crore. The EBITDA margin increased by 0.79 percentage points to 14.18% from 13.39%.
Profit after tax, or PAT, increased to Rs 255.6 crore in FY26 from Rs 204.9 crore in FY25, while PAT margin rose to 9.15% from 8.52%. Profit before tax increased to Rs 341.4 crore from Rs 276.2 crore, although depreciation and amortisation also rose to Rs 72.5 crore from Rs 64.3 crore.
The FY26 margin was the highest in FIEM’s FY22-to-FY26 consolidated series. It compared with 12.45% in FY22, 13.56% in FY23 and 13.33% in FY24. Consolidated earnings per share increased to Rs 97.11 in FY26 from Rs 77.86 in FY25; FIEM identifies FY22 and FY23 per-share figures as restated for post-bonus share capital.
What did FIEM report for the first half of FY27?
FIEM reported consolidated sales of Rs 1,702.1 crore and EBITDA of Rs 234.9 crore in H1FY27, resulting in an EBITDA margin of 13.80%. This was 0.38 percentage points below the 14.18% margin recorded for the full FY26 year, while H1FY27 PAT was Rs 148.9 crore and PAT margin was 8.75%.
Finance cost was Rs 2.2 crore in H1FY27, compared with Rs 2.8 crore for FY26, while other income was Rs 8 crore against Rs 20.8 crore for the full year. The presentation does not provide an H1FY26 income statement, so it does not permit a like-for-like year-on-year comparison of H1FY27 earnings.
H1FY27 sales were about 61% of FY26 consolidated sales, based on Rs 1,702.1 crore for the half year and Rs 2,792.1 crore for the previous full year. That comparison covers periods of different lengths and is not a management forecast for FY27.
What does FIEM’s balance sheet show about borrowings and liquidity?
FIEM reported nil borrowings under both current and non-current financial liabilities in its consolidated balance sheets at March 31, 2025, March 31, 2026 and September 30, 2026. The standalone financial overview also shows long-term loans at nil from FY23 through FY26, after Rs 20.5 crore in FY22.
Consolidated cash and cash equivalents were Rs 169.6 crore at September 30, 2026, down from Rs 279.4 crore at March 31, 2026 and Rs 298.3 crore at March 31, 2025. Over the six months to September 30, 2026, total equity rose to Rs 1,257.9 crore from Rs 1,215 crore, while total assets increased to Rs 1,884.3 crore from Rs 1,700.5 crore.
Lease liabilities were reported separately from borrowings. Consolidated non-current lease liabilities were Rs 57.2 crore and current lease liabilities were Rs 6.2 crore at September 30, 2026, compared with Rs 60.5 crore and Rs 5 crore, respectively, at March 31, 2026.
Got a follow-up? Ask IRIS
Why did FIEM’s working-capital days rise to 47?
FIEM does not state a specific cause for the increase in standalone working-capital days, but the measure rose to 47 in FY26 from 37 in both FY25 and FY24. The FY26 figure was also above 22 days in FY23, 23 days in FY22 and nine days in FY21, making it the highest in the six-year series shown.
Standalone trade receivables increased to Rs 388.2 crore at March 31, 2026 from Rs 242.4 crore a year earlier, while inventories increased to Rs 266.8 crore from Rs 233.3 crore. These movements coincided with standalone sales increasing to Rs 2,790.6 crore in FY26 from Rs 2,405 crore in FY25.
Trade payables also increased to Rs 288.3 crore at March 31, 2026 from Rs 230.4 crore at March 31, 2025. By September 30, 2026, standalone receivables had reached Rs 532.5 crore, inventories Rs 342.6 crore and trade payables Rs 389.2 crore; FIEM did not disclose working-capital days for that interim date.
How did FIEM’s returns and capital deployment change in FY26?
FIEM reported standalone return on capital employed, or ROCE, of 28.02% in FY26, up from 26.22% in FY25 and 11.66% in FY21. Return on equity, or ROE, increased to 22.62% in FY26 from 21.25% in FY25 and 8.55% in FY21.
Standalone capital expenditure was Rs 108.3 crore in FY26, lower than Rs 138.3 crore in FY25 but above Rs 85.8 crore in FY24. Gross block increased to Rs 1,101.7 crore from Rs 1,080.3 crore, while cash PAT rose to Rs 317.9 crore from Rs 269.3 crore.
Book value per share increased to Rs 460 in FY26 from Rs 393 in FY25. Dividend per share was Rs 40 in FY26, compared with Rs 30 in FY25 and Rs 20 in FY24; FIEM notes that its FY21-to-FY23 per-share data were restated for post-bonus share capital.
Conclusion
FIEM’s FY26 figures show higher consolidated scale, profitability and reported return measures alongside a balance sheet with nil reported borrowings. Sales increased by Rs 386.7 crore, the EBITDA margin reached 14.18%, and standalone ROCE rose to 28.02%, while working-capital days increased by 10 days to 47.
The unresolved point in the presentation is whether the higher receivable and inventory balances will translate into a sustained increase in working-capital intensity. FIEM disclosed September 30, 2026 standalone receivables of Rs 532.5 crore and inventories of Rs 342.6 crore, but did not disclose an interim working-capital-days measure, making subsequent disclosure of that metric and cash balances relevant to watch.