










Finbud Financial Services H1 FY27 Profit Falls 47.1% YoY
Key highlights
- Finbud reported H1 FY27 revenue from operations of ₹191.1 crore, up 37.5% year on year.
- Consolidated H1 FY27 net profit fell 47.1% year on year to ₹2.7 crore.
- Finbud's reported operating margin declined to 1.9% from 5.1% in H1 FY26.
- Profit before tax was ₹3.6 crore in H1 FY27, compared with ₹7.1 crore a year earlier.
powered by IRIS
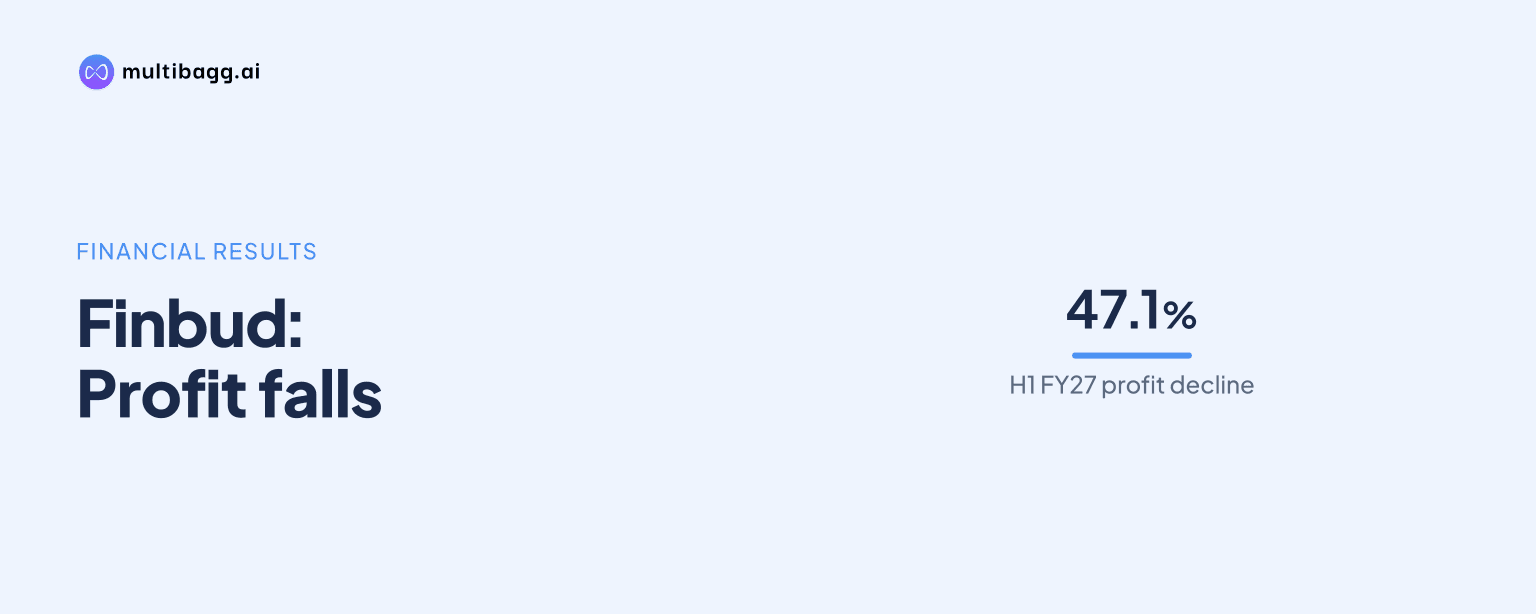
Finbud Financial Services Limited reported consolidated H1 FY27 net profit of ₹2.7 crore, down 47.1% year on year, even as revenue from operations rose 37.5% to ₹191.1 crore for the half year ended September 30, 2026. The figures point to a sharp reduction in operating profitability despite higher business volumes.
Know Finbud Financial Services inside out
Results, valuation, peers and who's buying, in one view.
What did Finbud Financial Services report for H1 FY27?
Finbud Financial Services Limited, referred to hereafter as Finbud, reported total income of ₹192.2 crore for H1 FY27, compared with ₹139.1 crore in H1 FY26. Revenue from operations rose from ₹139.0 crore to ₹191.1 crore, while other income increased to ₹1.0 crore from ₹0.2 crore.
The company reported profit before tax of ₹3.6 crore for the period ended September 2026, against ₹7.1 crore a year earlier. Consolidated net profit declined to ₹2.7 crore from ₹5.1 crore. The reported net-profit decline was 47.1% year on year.
Finbud's operating margin was 1.9% in H1 FY27, compared with 5.1% in H1 FY26. The available half-yearly data also shows earnings per share of ₹1.42 for September 2026, against ₹3.66 for September 2025.
When were the September 2026 results considered?
Finbud informed the exchange that its board meeting was scheduled for November 14, 2026, to consider and approve unaudited financial results for the period ended September 2026, along with other business. The consolidated H1 FY27 results were reported on November 14, 2026.
The September result follows the company's prior filing pattern. Its H2 FY26 results for the October 2025 to March 2026 period were filed on May 27, 2026, or 57 days after the end of that half year. Its H1 FY26 results were filed on December 1, 2025, 62 days after the September 2025 period-end.
The present filing is important because it gives investors the first reported view of Finbud's financial performance for FY27. While the revenue base expanded materially, the profit and margin movement indicates that expenses rose faster than operating income during the period.
How did costs affect Finbud's operating performance?
Costs increased alongside revenue in H1 FY27. Half-yearly financial data shows expenses of about ₹186 crore for September 2026, compared with about ₹130 crore for September 2025. This increase reduced operating profit to about ₹5 crore from about ₹9 crore in the corresponding prior-year period.
The operating profit margin, shown in the half-yearly table as 2.7%, was lower than 7% in September 2025. The results summary separately reported an operating margin of 1.9%, compared with 5.1% a year earlier. Both measures show a significant contraction from the previous year's first half.
Interest expense and depreciation were each shown at about ₹1 crore in the September 2026 half-yearly data. The supplied result tables do not provide a detailed cost break-up or a management explanation for the higher expenses. Therefore, the reported figures establish the margin outcome but do not identify individual expense drivers.
Got a follow-up? Ask IRIS
How does H1 FY27 compare with Finbud's recent financial record?
Finbud's H1 FY27 revenue from operations of ₹191.1 crore exceeded the ₹177.1 crore reported in H2 FY26 and ₹139.0 crore in H1 FY26. Total income was ₹192.2 crore, above ₹178.7 crore in H2 FY26 and ₹139.1 crore in H1 FY26.
However, profit before tax of ₹3.6 crore was below ₹8.2 crore in H2 FY26 and ₹7.1 crore in H1 FY26. Net profit of ₹2.7 crore was also lower than ₹6.5 crore in H2 FY26 and ₹5.1 crore in H1 FY26. The reported quarter-on-quarter net-profit change was a decline of 58.5%.
For FY26, Finbud had reported revenue of ₹318 crore, up 42% from FY25, and net income of ₹11.65 crore, up 37%. Its FY26 profit margin was 3.7%, marginally lower than 3.8% in FY25, with higher expenses cited as the reason for the decline. The H1 FY27 result continues the pattern of strong revenue growth alongside pressure on profitability.
What does the H1 FY27 result mean for investors?
For investors, the key development is the difference between revenue growth and earnings growth. Revenue from operations increased by more than one-third year on year, but net profit almost halved. The operating-margin decline means a smaller portion of revenue was retained as operating profit in H1 FY27.
The result also matters for assessing the pace at which Finbud can translate higher activity into earnings. H1 FY26 had produced ₹5.1 crore of net profit on ₹139.0 crore of revenue, while H1 FY27 produced ₹2.7 crore on ₹191.1 crore of revenue. The change makes expense management and profitability trends relevant points in subsequent disclosures.
No share-price movement, forward earnings guidance, dividend decision, or detailed operational update was provided in the supplied information. Market participants therefore have the reported financial figures and the board-meeting disclosure, but no stated management target for the remaining half of FY27.
Conclusion
Finbud's H1 FY27 filing shows that its revenue base continued to grow, with revenue from operations reaching ₹191.1 crore. But higher expenses coincided with a substantial fall in operating margin, profit before tax, and net profit. The result shifts attention from topline expansion to the company's ability to protect profitability.
The next reported financial milestone is the H2 FY27 result for the period ending March 2027. Investors will watch whether Finbud discloses further detail on costs and whether margins improve from the levels reported for the September 2026 half year.